I know you’re familiar with this company — Tesla Inc. (Nasdaq: TSLA).
Many of you probably own it.
If you don’t, now is the time to get back in, as the company is poised to double in the next 12 months.
I’ll say this right off the bat: Tesla is not the same company as it was just five years ago.
Love him or hate him, Elon Musk’s technological powerhouse is most well-known for its strong hold on the electric vehicle (EV) market.
Even though EVs aren’t all the rage as they were a few years ago, U.S. sales still jumped 60% year-over-year (YoY), from 1 million in 2022 to 1.6 million in 2023.
EVs have sold slower than expected lately though. This has led to price cuts and smaller profit margins.
In recent months, Tesla knocked $2,000 off the prices of the Models X and S, reducing the starting price to $77,990 for a Model X and $72,990 for a Model S.
And in the overall EV market, according to Cox Automotive, the average transaction price for a new EV decreased by 9% in first-quarter (Q1) 2024 compared to Q1 2023.
Edmunds also predicts that the EV growth rate will slow through 2024, increasing to just 8% of the new vehicle market share from 6.9% last year and 5.2% in 2022.
But this won’t last much longer. And much of this is already priced into TSLA shares.
I believe EV adoption will accelerate in the next few years; especially as the cost of making EVs continues to fall, and the government continues to incentivize buyers with steep tax credits.
And there is no other automaker better positioned to capitalize on this trend than Tesla.
But that’s not the main reason I believe it’s time to buy its stock right now. You see…
Today, Tesla is so much more than an EV company.
It’s more than a tech company.
It’s a futuristic powerhouse.
It develops some of the most advanced intellectual properties we have today — with staying power.
Meaning, because of its success in the EV market, Tesla’s products and software have infiltrated several industries.
From 2000 to 2023, Tesla filed over 3,400 patents worldwide (and counting).
This includes energy storage and generation, manufacturing automation and autonomous vehicles.
These innovations represent the present and future of the auto industry, and even the overall tech market. (More on that in a moment.)
And okay, yes. I know Tesla’s gotten a lashing in the last few years … especially its share price.
A 75% TSLA collapse from its November 2021 high to its low in January 2023 is pretty jarring…
But I believe the worst is behind us.
While it might not be up in a straight line from here, I believe that if you pick up shares of Tesla now, you’ll look back on this moment in a few years and be very happy.
In fact, just a few years ago, my subscribers had the opportunity to turn Tesla into two big winners…
I first recommended the stock in August 2019, where readers saw a 552% gain after we sold half the position in July 2020.
Two months later in September, I believed the stock was overcrowded. We sold the remaining half of the position for a 919% gain.
Now, I don’t think we’ll see that in the next 12 months.
But this kind of return is likely throughout the rest of the decade — and potentially even more!
Why?
Because aside from its niche in the EV market…
Tesla has also developed not one, but two incredible feats of engineering.
They could not only change the way we drive … but also change our lives.
Tesla’s technology could also generate billions in future revenue for the company.
Tesla’s Full Self-Driving Capabilities
Autopilot, while a groundbreaking development for driver assistance, was just the foundation.
Tesla introduced Full Self-Driving in 2020.
FSD allows Tesla EVs to drive themselves nearly anywhere with minimal driver intervention.
But let’s be clear. FSD is not fully autonomous … yet.
You still need an alert human at the steering wheel while using FSD.
According to Tesla, aside from the standard Autopilot capabilities, FSD can:
Navigate on Autopilot: Actively guide your vehicle from a highway’s on-ramp to off-ramp. This includes suggesting lane changes, navigating interchanges, automatically engaging the turn signal and taking the correct exit.
Auto Lane Change: Assist in moving to an adjacent lane on the highway when engaging Autosteer.
Autopark: Help automatically parallel or perpendicular park your vehicle, with a single touch.
Summon: Move your vehicle in and out of a tight space using the mobile app or key.
Smart Summon: Your vehicle will navigate more complex environments and parking spaces, maneuvering around objects to come find you in a parking lot.
Autosteer on City Streets: Taking Autopilot to the next level.
Traffic and Stop Sign Control: Identify stop signs and traffic lights and automatically slow your vehicle to a stop on approach, with your active supervision.
Those are some major upgrades.
So now, here’s why I think FSD is a game-changer for Tesla.
The Debut of the Tesla Robotaxi!
That’s right. I’m talking about “car-to-door,” which means fully autonomous driving with no humans at the controls.
And the more people buy Tesla vehicles that use FSD and Autopilot (AKA: the mass adoption phase)…
The more it will set the stage for the company’s Robotaxi rollout.
As InsideEVs reported, at Tesla’s 2024 shareholder vote meeting on June 13, Musk said:
“Robotaxis could rocket the company to a market valuation between $5 trillion and $12 trillion.”
That’s why I want you to mark your calendars…
Because Musk says Tesla will reveal its Robotaxi on October 10, 2024.
This is one of those technologies where its economic impact is almost impossible to fathom.
Forecasts for the value of a Robotaxi fleet are all over the place.
UBS believes that this will be a $2 trillion opportunity by 2030.
It’s so big that Cathie Wood’s ARK Invest estimates that in 2029, the Robotaxi will account for nearly 90% of Tesla’s enterprise value and earnings.
And ARK has a $2,600 price target on TSLA!
But like I said, this isn’t the only breakthrough technology Tesla has in store…
You’ll have to tune in on October 10 to find out.
If you missed my special video presentation last week, click here to see it before October 10 arrives.
Debra Martin Chase brought us girlhood cult classics like The Princess Diaries and The Sisterhood of the Traveling Pants. But about 10 years ago, Chase, who now serves as CEO of Martin Chase Productions, almost gave up on the entertainment business.
“It was just a time in business where nobody was interested in making TV or movies about women, about women of color, about people of color. It just was not happening,” Chase said during a main stage interview at Fortune’s Most Powerful Women Summit in Laguna Niguel, Calif., on Tuesday. “I would go in and pitch stuff and people’s eyes would glaze over.”
That was a tough pill to swallow for Chase, who said she had committed her career in entertainment to bringing more diversity to the big screens. She wanted to have an impact on culture and industry.
“Then all of a sudden, I found myself just throwing stuff up against the wall,” Chase said. “It didn’t have meaning for me. And if it doesn’t have meaning for me, I can’t sell it.” At that point, she thought it was the universe’s way of telling her she’d had a good run in the entertainment business. At that point, she had been with Disney for 20 years, but the people who had invested in her personally were “long gone.”
At that point, she thought of exploring other options including film finance or law (she earned her J.D. from Harvard Law School). But a longtime friend convinced her to keep course—Vernon Jordan Jr., no less. Jordan was an American business executive and civil rights attorney who was a close adviser to President Bill Clinton and executive director of the National Urban League. He passed away at his home in Washington, D.C., in March 2021 at the age of 85. Chase had known him since she was 18 years old.
He was an “expert in life and knew me well,” Chase said. “He sat there and he listened to me as I poured my heart out, and he looked at me and he said, ‘You are too old to do anything else.’”
But Jordan also told Chase: “You have a great reputation, you have great relationships, you have great experience. You need to figure out how to make it work.” That served as a slap in the face for Chase—as she demonstrated literally on stage—and kept her on the film production path.
Sisterhood has been key in surviving the entertainment business
In addition to Jordan’s advice, Chase and her fellow panelists Pearlena Igbokwe, chairman of Universal Studio Group, and Nina Shaw, founding partner of entertainment law group Del Shaw Moonves Tanaka Finkelstein Lezcano Bobb & Dang, said there has been another key to success in Hollywood: sisterhood.
“Literally, these women have held me up, and I know we’ve helped each other,” Chase said.
From left:
Nina Shaw, Founding Partner, Del Shaw Moonves Tanaka Finkelstein Lezcano Bobb & Dang; Debra Martin Chase, Chief Executive Officer, Martin Chase Productions;
Pearlena Igbokwe, Chairman, Universal Studio Group
Kristy Walker/Fortune
And these three women have been supporting each other for a long time. Shaw first met Chase when she was a summer clerk and Chase was a paralegal—and the two of them were friends with Anita Hill, the renowned attorney who first entered the spotlight after giving her testimony in the 1991 Senate confirmation hearings for U.S. Supreme Court nominee Clarence Thomas, whom she accused of sexual harassment. Hill was also a summer clerk at the time.
“We were the three Black women,” Chase said, adding she had also met Igbokwe early on in her career—and now the two work together. Igbokwe currently oversees more than 100 projects across more than 25 platforms worldwide, bringing us hits like Law & Order and Hacks. “It’s the sisterhood.”
Chase also discovered other renowned writers, producers and actors including Shonda Rhimes, Anne Hathaway, Blake Lively, and Jesse Williams. Shaw credits Chase with introducing her to musician John Legend, who is now her client. Legend’s producing partner had contacted Chase one night in search of a lawyer and Shaw happened to be in the car with Chase that night. The two of them headed to Legend’s house that night and signed him, which led to other major connections for Shaw—including Quinta Brunson, creator of the hit TV show Abbott Elementary.
While these three women are dominating the entertainment industry, none of their paths were linear—or easy.
“I say to people I was a 30-year overnight sensation,” Igbokwe said. “When I got this job as chairman, [people said] ‘she came out of nowhere. For some people, that was the perception. For me, it was steadily working in the business.”
In Europe, shareholder approval and pre-emption rights have traditionally fulfilled an important role in protecting shareholders in listed corporations against excessive dilution in share issuances. However, these protections also make it costlier and slower to raise capital through share issuances. That is why countries generally allow shareholders to authorize the board of directors to issue shares without shareholder approval and without pre-emption rights – within certain limits. The protection offered by pre-emption rights and shareholder approval therefore depends on the extent to which shareholders are willing to approve authorizations to issue shares and disapply pre-emption rights.
In a paper recently published in the Journal of Corporate Law Studies, I provide new empirical evidence on the flexibility of such authorizations in practice in French and Belgian listed corporations. Proxy advisors and (associations of) asset managers have adopted guidelines on the maximum size for authorizations – typically 50% of legal capital for authorizations to issue shares with pre-emption rights, and 10% of legal capital for authorizations to issue shares without pre-emption rights (although Glass Lewis is more flexible for Belgium, with thresholds of 100% and 20%, respectively).
However, my evidence shows that these guidelines are often not followed in Belgium and France. Outside the BEL 20, Belgian corporations almost never respect the 50% limit recommended by ISS. In addition, for authorizations to disapply pre-emption rights, 55% of Belgian corporations do not observe the 20% limit (recommended by Glass Lewis) and 69% do not observe the 10% limit (recommended by ISS). Even in the BEL 20, 47% of corporations do not observe the 10% limit and 27% do not observe the 20% limit.
The guidelines of institutional investors seem to be respected more often than in Belgium. For example, in the CAC 40, the largest index in France, there are no corporations that do not respect the 50% limit for general authorizations and only 4 corporations that do not respect the 10% limit for authorizations to disapply pre-emption rights. Outside the CAC 40, compliance with the guidelines is less common: 28% of corporations do not respect the 50% limit and 67% of corporations do not respect the 10% limit.
These empirical findings stand in stark contrast with the situation in the UK, where previous research has found that the Pre-emption Guidelines and Share Capital Management Guidelines (which impose similar restrictions on authorizations) are widely observed by UK corporations.
I also provide empirical evidence through a multiple regression model that authorizations are generally more flexible in corporations with high levels of insider ownership, corporations with a smaller market capitalization, and Belgian corporations. I offer several potential explanations for these differences.
First, higher insider ownership generally makes it easier for insiders to control the vote in the general meeting and force through more flexible authorizations that benefit them. This does not necessarily mean that high levels of insider ownership are inefficient, as controlling shareholders may also have benefits.
Second, small corporations may have more flexible authorizations than large corporations because small corporations generally receive less attention from investors, activists, the media and research analysts. Alternatively, it may be that smaller corporations have higher capital needs, and therefore need more flexible authorizations.
Finally, the difference between Belgium and France could be explained by differences in the legal framework. Authorizations in Belgium are almost invariably given for the maximum period allowed by the law, five years. In France, the law imposes a shorter maximum duration on authorizations of 26 months. If shareholders can vote more often on authorizations, they have more opportunities to hold insiders accountable, which could explain the stricter authorizations in France. In addition, French law requires that shareholders vote on separate resolutions for authorizations for share issuances with pre-emption rights and authorizations for share issuances without pre-emption rights, while this is not the law or market practice in Belgium. Separate votes for pre-emptive and non-pre-emptive authorizations can ensure that shareholders are not coerced into voting for excessive authorizations for non-pre-emptive share issuances out of an unwillingness of voting against any form of authorization for the corporation, which would likely be inefficient. The lack of separate votes can explain why only 8 of 84 Belgian corporations have adopted stricter authorizations for non-pre-emptive share issuances than for pre-emptive share issuances.
The paper also analyzed whether authorizations to issue shares could be used as a takeover defense. Here, a similar picture emerges: despite the fact that the guidelines of proxy advisors and asset managers generally oppose takeover defenses, more than 40% of Belgian corporations and 28% of French corporations have an authorization to issue shares that can be used as a takeover defense. Again, such takeover defenses are more common in corporations with high levels of insider ownership and corporations with a smaller market capitalization. Institutional ownership is also significantly negatively associated with the likelihood of adopting an authorization that can be used as a takeover defense. The difference between Belgium and France is no longer statistically significant, however. A possible explanation is that the default rule in Belgium is that authorizations to issue shares cannot be used as a takeover defense, while the default rule is the opposite in France. This difference in the default rule may be enough to counterbalance the general trend of more flexible authorizations in Belgium than in France.
The empirical analysis in the paper was not designed to test whether the currently adopted authorizations are too flexible or too strict. Nevertheless, I do believe that the differences in the legal framework identified between Belgium and France could inspire policy proposals that give shareholders a larger say in the flexibility of authorizations to issue shares and disapply pre-emption rights. For example, the legal rule in France that requires a shareholder vote every two years and a separate shareholder vote on the authorization to disapply pre-emption rights could also be introduced in Belgium. It is possible that such reforms will not be effective in reducing the size of authorizations, either because shareholders believe the current flexible authorizations are efficient, or because a controlling shareholder makes it impossible for other shareholders to have an impact on the shareholder vote anyway. Even in that case, these policy proposals would be relatively harmless, as the costs of implementing them are limited: management may need to spend some extra effort in convincing shareholders that the authorization is justified, but the authorization can simply be approved during the annual general meeting that would have to be organized anyway. In addition, corporations would retain the possibility to adopt more flexible authorizations if this is efficient, provided that they can convince a sufficient number of shareholders of this.
That is why I argue that these low-cost proposals can help to empower shareholders to decide how the balance between flexibility and accountability should be struck with regards to authorizations to issue shares.
Tom Vos
Visiting professor at the Jean-Pierre Blumberg Chair University of Antwerp; Attorney at Linklaters LLP; Voluntary Scientific collaborator at the KU Leuven
Author: Tom Vos
Tom Vos is an assistant professor at the Department of Private Law of Maastricht University. In his research, he focusses on corporate law, corporate governance, law and economics, and empirical studies. In addition to that, Tom is a visiting professor (10%) at the Jean-Pierre Blumberg Chair at the University of Antwerp, where he teaches a course on international corporate governance. Finally, Tom is a (part-time) Associate at the Corporate and Finance Practice at Linklaters Belgium, where he advises clients on corporate governance and securities laws.
View all posts by Tom Vos
Fintech is booming in Australia! The sector is now worth around $45billion AUS (over $30billion USD) – a 17900 per cent rise from 2015’s value ($250billion AUS/$168million USD) according to FintechAustralia. But what subsectors are leading the way and can the country keep up its growth?
First, let’s take a step back and look at the financial landscape in Australia more generally. Despite its market stalling in H1’24, Australia’s economy still remains a major player globally with a gross domestic product (GDP) per capita of over $65,000 according to the WorldBank.
According to the KPMG Fintech Landscape 2023, the ecosystem is very diverse in Australia with over 830 independent fintechs headquartered in the region.
The fintech landscape
The Australian state of New South Wales, home to the country’s capital, has the largest percentage of fintech companies (60 per cent). This is followed by Victoria (24 per cent) and Queensland (12 per cent).
The country is also home to various unicorns. These include cross-border payments Airwallex, buy now pay later (BNPL) Afterpay and challenger bank Judo Capital.
The payments subsector is the largest in Australia. It has a 20 per cent share of all fintechs in the country with over 160 firms. Lending and wealthtech take second and third place respectively. Lending represents 17 per cent of the market (140 fintechs), while wealthtech represents 10 per cent.
Open banking is another notable subsector in Australia. The majority of the APAC region’s adoption of the technology has been market-driven – however, in Australia, regulations have driven its development. This was evident in July 2019, when Australia launched its open banking regime, based on consumer data right (CDR) legislation. The regime’s aim was to give customers more control over their data and easier access to products and services they required.
There were other milestones in 2019 too. For example, major banks celebrated application programming interfaces (APIs) and eligible product data, such as rates, fees, and terms and conditions. A year later, individual account holders and sole traders could share data relating to their retail banking products.
In 2021, data sharing was further improved as customers could share information business lending, trust accounts, overdrafts, asset finance, lines of credit and foreign currency accounts. Additionally, major banks allowed for data sharing for non-individuals, secondary users and business partnerships.
Recent news
Australia was not able to escape the declines in fintech funding experienced across the world. In terms of deal activity, it saw a 61.9 per cent decline from 42 deals in Q2’23 to 16 in QR’24. From a funding point of view, there was also a drop as the country raised $475million in Q2’24 which was 73.5 per cent lower than Q2’23 ($1.8billion).
According to Fintech Australia’s fourth edition of its Australian Open Banking Ecosystem Map and Report, which was supported by Mastercard, and in partnership with FinTech NZ, Payments NZ and Open Finance ANZ, the country saw a 165 per cent increase in consumer data right (CDR) participants. Other findings revealed that nearly all consumer bank accounts (99.74 per cent) are now connected to the open banking ecosystem, positioning Australia for further adoption of open banking technologies.
Last month, the Australian government proposed the introduction of a Scams Prevention Framework (SPF), implementing new mandatory scam obligations across all sectors. The Bill, which would insert the SPF into the ‘Competition and Consumer Act 2010,’ is expected to be introduced to the federal parliament next month.
For many customers who come into Bishop’s Restaurant, located at 1638 Columbus Rd., Wooster, it feels a lot more like sitting down to eat at a family member’s house than at a restaurant.
A lot of the longtime diners are practically family to owner Denise Dorsey. She started with Bishop’s at age 16 in 1980 as a drive-in car hop when she was a student at Norwayne High School.
Bishop’s was originally located off of Cleveland Rd, at the location where College Hills Honda now calls home. It was founded in late 1959.
Bishop’s was moved in 2002 to a location south of Orrville on the busy intersection of U.S. route 30 and Wadsworth Rd, across from Riceland Golf Course. The Orrville location closed in 2011 due largely to disrepair of the building, which was connected to the Gold Star Inn, and was recently demolished.
Dorsey loved being part of the Bishop’s business so much that she took over as owner in 2009. After the 2011 closing, she gave Bishop’s a third act – starting in 2013 – at its current location.
“We offer in-person service here, you’re not going to place your order into a machine,” Dorsey said proudly. “We have a lot of customers who’ve been with us at all three locations and we’re always happy to add new ones.
“We have a relaxed dining room atmosphere and the patio will be opening soon. And we still have the car-hop service.”
Bishop’s famous Nutty Muffit, a delicious burger with cole slaw and chopped-up nuts, and onion rings are legendary in Wayne County and well beyond.
Dorsey also bakes fresh pies daily and offers the “secret” deep frying batter mix for to-go cooking, such as homemade beer-battered fish.
There are lots of other meal choices, including healthy salads.
Of course, Dorsey couldn’t do it without her restaurant staff, which includes her son, Zach Dorsey.
“Zach has been a huge part of operating this location,” Denise said. “He takes care of our maintenance and technical issues. He peels and slices the majority of the onions that we use. I really appreciate everyone who’s worked here.”
An original, oversized menu board is behind the front counter. It lists the Nutty Muffit for .75 cents, a hot dog for .25 cents and tossed salad for .35 cents.
Of course, prices have gone up over the years, but the tradition and small-town flavors remain largely unchanged.
“If it isn’t broken, don’t fix it,” said Dorsey, of keeping many of the longtime menu items and cooking techniques. “Of course, we’ve also modernized since moving to our current location and updated some of our methods.
“We have a great staff here and really appreciate our customers. They’ve even stuck with us through the COVID-19 pandemic, when we had to go to only car-hop and carry out for a while. We’re glad that most of our customers are dining in with us again – we take special precautions for cleaning and sanitation. We’re looking forward to a fun spring and summer.”
Updated on September 20th, 2024 by Bob Ciura Data updated daily
Dividends are the most common method that a company can use to return capital to shareholders. Dividend growth investors often place significant emphasis on dividend yields and dividend growth as a result.
Naturally, dividend growth investors are attracted to high-quality stocks such as the Dividend Aristocrats, an exclusive group of stocks in the S&P 500 Index with 25+ consecutive years of dividend increases.
However, there are additional ways for companies to create value for shareholders.
In addition to dividends, share repurchases are also an important part of a healthy capital return program. Debt reduction should also be welcomed by investors.
Related: Learn more about share repurchases in the video below.
There is a single financial metric that incorporates each of these factors (dividend payments, share repurchases, and debt reduction). It is called shareholder yield – and stocks with high shareholder yields can make fantastic long-term investments.
With that in mind, the High Shareholder Yield Stocks List that you can download below contains 349 stocks with positive shareholder yields, meaning that they offer a dividend, buybacks, and/or debt reduction of some kind.
The spreadsheet list was derived from the Cambria Shareholder Yield ETF.
Keep reading this article to learn more about the merits of investing in stocks with above-average shareholder yields.
What Is Shareholder Yield?
To invest in the stocks with the highest shareholder yields, you have to find them first. The High Shareholder Yield Stocks List helps identify stocks with high shareholder yields.
Shareholder yield measure how much money a company is returning to its shareholder through dividend payments, share repurchases, and debt reduction.
It is expressed as a percent, and can be interpreted as the answer to the following question: ‘How much money will be returned to me through dividend payments, share repurchases, and debt reduction if I buy $100 of company stock?’
Mathematically, shareholder yield is defined as follows:
Alternatively, shareholder yield can be calculated using company-wide metrics (instead of per-share metrics).
The common sense interpretation of shareholder-yield is the percent of your invested money that is devoted to activities that are quantitatively shareholder-friendly (dividend payments, share repurchases, and debt reductions).
How To Use The High Shareholder Yield List To Find Dividend Investment Ideas
Having an Excel document full of stocks that have high shareholder yields can be very useful.
However, the true power of such a document can only be unlocked when its user has a rudimentary knowledge of how to use Microsoft Excel.
With that in mind, this section will provide a tutorial of how to implement two additional screens (in addition to the screen for high shareholder yields) to the High Shareholder Yield Spreadsheet List.
The first screen that will be implemented is a screen for stocks that are trading at a trailing price-to-earnings ratio less than 16.
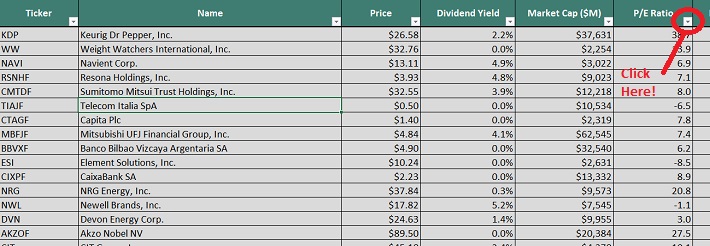
Step 1: Download the High Shareholder Yield Spreadsheet List at the link above.
Step 2: Click on the filter icon at the top of the ‘PE Ratio’ column, as shown below.
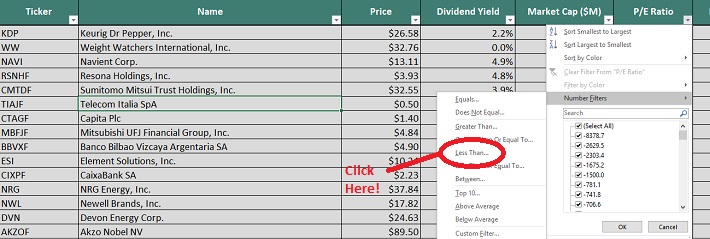
Step 3: Change the filter setting to ‘Less Than’ and input ’16’ into the field beside it.
This will filter for stocks with high shareholder yields and forward price-to-earnings ratios below 16.
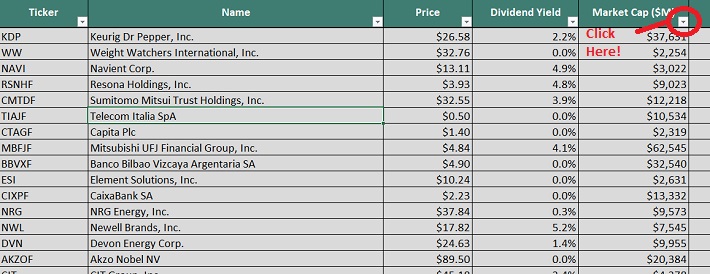
The next filter that will be implemented is for stocks with market capitalizations above $10 billion (which are called large capitalization – or ‘large cap’ – stocks).
Step 1: Download the High Shareholder Yield Spreadsheet List at the link above.
Step 2: Click on the filter icon at the top of the ‘Market Cap’ column, as shown below.
Step 3: Change the filter setting to ‘Greater Than’ and input 10000 into the next field. Since the market capitalization column is measured in millions of dollars, this will filter for stocks with market capitalizations higher than $10 billion (which represent the ‘large cap’ universe of stocks).
The remaining stocks in this Excel sheet are those with high shareholder yields and market capitalizations of $10 billion or higher.
Now that you have an understanding of how to use the High Shareholder Yield Stocks List, the remainder of this article will explain how to calculate & interpret shareholder yield and will also explain some of the benefits of investing in securities with high shareholder yields.
Why Invest In Stocks With High Shareholder Yields?
There are a number of benefits to investing in stocks with high shareholder yields.
The first and perhaps most obvious benefit to investing in high shareholder yield stocks is the knowledge that the company’s management has its shareholders’ best interests at heart.
A high shareholder yield indicates that dividend payments, share repurchases, and debt reductions are a top priority for management.
In other words, high shareholder yields are correlated with a corporate culture that emphasizes shareholder well-being.
The second and more important benefit to investing in stocks with high shareholder yields is that they have a proven record of delivering outsized total returns over meaningful periods of time.
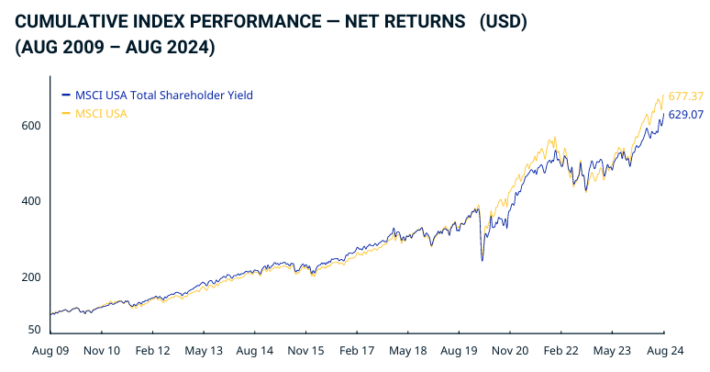
This can be seen by looking at stock market indices that focus on stocks with high shareholder yields.
For instance, the image below compares the returns of the MSCI USA Total Shareholder Yield Index to a broader universe of domestic stocks – the MSCI USA Index.
Source: MSCI USA Total Shareholder Yield Fact Sheet
Since inception, the MSCI USA Total Shareholder Yield Index has outperformed the broader index, delivering annualized returns of 7.88% per year compared with 7.25% for the MSCI USA Index.
Why is this especially impressive?
Well, it is because the past 5 years have witnessed a robust bull market and a corresponding increase in asset prices.
A significant component of shareholder yield is share repurchases. Share repurchases occur when a company buys back its stock for cancellation, increasing the part ownership of each continuing shareholders.
Importantly, share repurchases are significantly more effective during bear markets than during bull markets because the same dollar value of share repurchases can buy back a larger amount of company stock.
This common-sense characteristic of high shareholder yield stocks – that they should outperform during recessions – is an admirable trait and should be appreciated by investors who incorporate shareholder yield into their investment strategy.
But it is also impressive that these stocks have also outperformed in the past 5 years.
Top 5 Shareholder Yield Stocks Now
This section will rank the top 5 shareholder yield stocks from the spreadsheet that are covered in the Sure Analysis Research Database.
The following 5 shareholder yield stocks are ranked by 5-year annual expected returns, from lowest to highest.
Estee Lauder is one of the world’s largest cosmetics and beauty care companies. It competes primarily in the upscale and prestige portion of the market. Sales break down as follows: Skin care makes up 52% of sales, makeup constitutes 28%, fragrance is another 16%, and hair care is the other 4%.
The leading brands include the namesake Estee Lauder along with Clinique, Aveda, M.A.C., and Origins among others. Estee Lauder is a truly international firm, operating in more than 150 countries. Revenues are split almost equally in thirds between the Asia-Pacific, Europe Middle East & Africa, and the Americas segments.
The company reported its Q4 and full-year 2024 results on August 19th, 2024. Earnings-per-share of 64 cents declined from $1.08 for the same period of last year, but topped expectations. Revenues of $3.9 billion increased 7% year-over-year, marking a healthy reversal from the company’s recent sales declines.
Click here to download our most recent Sure Analysis report on EL (preview of page 1 of 3 shown below):
Shareholder Yield Stock #4: Perrigo Company (PRGO)
5-year annual expected returns: 18.3%
Perrigo is headquartered in Ireland. It operates in the healthcare sector as a manufacturer of over-the-counter consumer products.
Its Consumer Self-Care Americas segment is comprised of the U.S., Mexico and Canada consumer healthcare businesses. The Consumer Self-Care International segment includes branded consumer healthcare business primarily in Europe, but also Australia and Israel. The company generates ~$4.7 billion in annual revenue.
On August 2nd, 2024, Perrigo announced second quarter earnings results for the period ending June 30th, 2024. For the quarter, revenue decreased 10.7% to $1.1 billion, which was $60 million less than expected. Adjusted earnings-per-share of $0.53 compared unfavorably to $0.63 in the prior year, but this was $0.07 above estimates.
Organic revenue decreased 9.1% for the period. Consumer Self-Care Americas’ organic sales were down 15.1% due to weaker infant formula results and a product prioritization. Outside of Women’s Health and Healthy Lifestyle, all product categories were lower from the prior year.
Click here to download our most recent Sure Analysis report on PRGO (preview of page 1 of 3 shown below):
Shareholder Yield Stock #3: Alphabet Inc. (GOOG) (GOOGL)
5-year annual expected returns: 19.4%
Alphabet is a holding company. With a market capitalization that exceeds $2 trillion, Alphabet is a technology conglomerate that operates several businesses such as Google search, Android, Chrome, YouTube, Nest, Gmail, Maps, and many more. Alphabet is a leader in many of the areas of technology that it operates.
Alphabet has a market cap above $2 trillion, making it a mega-cap stock.
There are two classes of Alphabet stock, Class A shares, which has voting rights, and Class C shares, that do not have voting rights. This report will reference the Class A shares. On July 23rd, 2024, Alphabet declared its second ever quarterly dividend of $0.20 per share.
Also on July 23rd, 2024, Alphabet announced second quarter results for the period ending June 30th, 2024. As had been the case for several quarters, the company delivered better than expected results.
Revenue improved 13.6% to $84.7 billion for the period, topping analysts’ estimates by $450 million. Adjusted earnings-per-share of $1.89 compared very favorably to $1.44 in the prior year and was $0.04 more than expected.
Click here to download our most recent Sure Analysis report on GOOGL (preview of page 1 of 3 shown below):
Shareholder Yield Stock #2: Baxter International (BAX)
5-year annual expected returns: 22.5%
Baxter International develops and sells a variety of healthcare products, including biological products, medical devices, and connected care services devices used to monitor patients. Its products are used in hospitals, kidney dialysis centers, nursing homes, doctors’ offices, and patients at home under physician supervision.
On August 6th, 2024, Baxter International reported second quarter earnings results for the period ending June 30th, 2024. For the quarter, revenue grew 2.8% to $3.81 billion, which was $60 million above estimates. Adjusted earnings-per share of $0.68 compared favorably to $0.55 in the prior year and was $0.02 better than expected.
Starting with Q3 2023, the company now has four reportable business segments. All of the businesses within the company showed year-over-year growth on a constant currency basis. Excluding the impact of currency exchange, Kidney Care revenue was higher by 3% to $1.1 billion.
Medical Products & Therapies grew 5% to $1.32 billion, Healthcare Systems & Technologies was up 1% to $748 million, and Pharmaceuticals increased 9% to $602 million. The adjusted gross margin expanded 80 basis points to 41.2%.
Click here to download our most recent Sure Analysis report on BAX (preview of page 1 of 3 shown below):
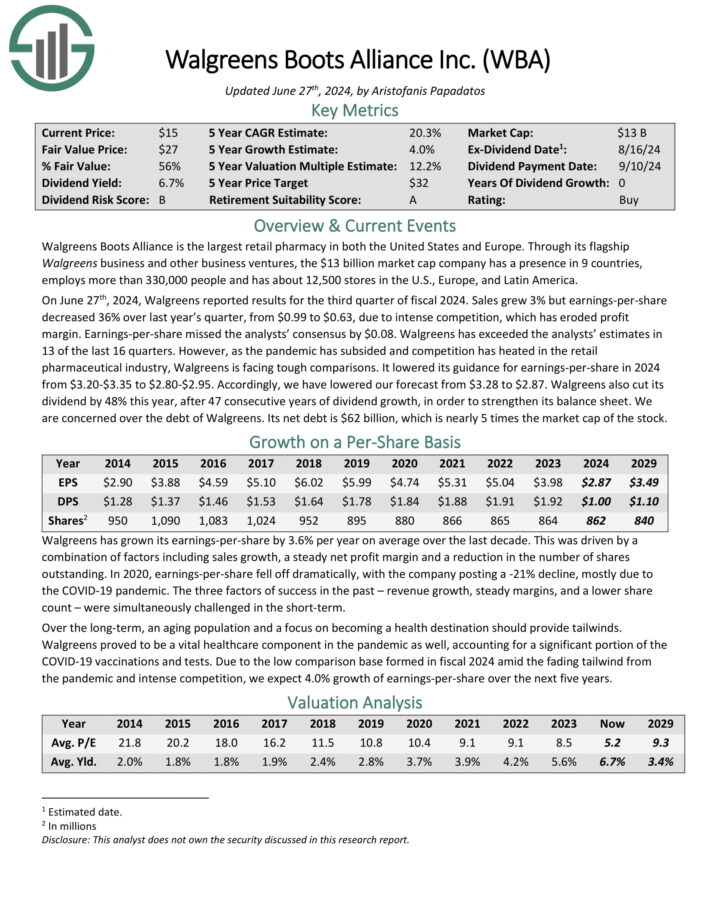
Walgreens Boots Alliance is the largest retail pharmacy in both the United States and Europe. Through its flagship Walgreens business and other business ventures, the $13 billion market cap company has a presence in 9 countries, employs more than 330,000 people and has about 12,500 stores in the U.S., Europe, and Latin America.
On June 27th, 2024, Walgreens reported results for the third quarter of fiscal 2024. Sales grew 3% but earnings-per share decreased 36% over last year’s quarter, from $0.99 to $0.63, due to intense competition, which has eroded profit margin.
Source: Investor Presentation
Earnings-per-share missed the analysts’ consensus by $0.08. Walgreens has exceeded the analysts’ estimates in 13 of the last 16 quarters.
However, as the pandemic has subsided and competition has heated in the retail pharmaceutical industry, Walgreens is facing tough comparisons. It lowered its guidance for earnings-per-share in 2024 from $3.20-$3.35 to $2.80-$2.95. Accordingly, we have lowered our forecast from $3.28 to $2.87.
Click here to download our most recent Sure Analysis report on WBA (preview of page 1 of 3 shown below):
Other Sources of Compelling Investment Ideas
Stocks with high shareholder yields often make fantastic investment opportunities.
However, they are not the only signs that a company’s management has the best interest of its shareholders at heart. Moreover, shareholder yields are only one (there are many others) of the quantitative signals that a stock may deliver market-beating performance over time.
One of our preferred signals for the shareholder-friendliness and future prospects of a company is a long dividend history. A lengthy history of steadily increasing dividend payments is indicative of a durable competitive advantage and a recession-proof business model.
With that in mind, the following databases of stocks contain stocks with very long dividend or corporate histories, ripe for selection for dividend growth investors.
Investors can also look to the dividend portfolios of successful, institutional investors for high-quality dividend investment ideas.
Large portfolio managers with $100 million or more of assets under management must disclose their holdings in quarterly 13F filings with the U.S. Securities & Exchange Commission.
Sure Dividend has analyzed the equity portfolios of the following high-profile investors in detail:
Thanks for reading this article. Please send any feedback, corrections, or questions to support@suredividend.com.
The unabridged Market’s Compass Emerging Markets Country ETF Study will be published next Monday but last week’s explosive positive price action in the iShares MSCI Emerging Markets ETF or EEM, and a number of EM Country ETFs is noteworthy prompting me to publish this brief interim report. Paid subscribers are familiar with my Objective Technical Rankings, what follows is an explanation for those who are not.
The Excel spreadsheet below indicates the weekly change in the Technical Ranking (“TR”) of each individual ETF. The technical ranking or scoring system is an entirely quantitative approach that utilizes multiple technical considerations that include but are not limited to trend, momentum, measurements of accumulation/distribution and relative strength. If an individual ETFs technical condition improves the Technical Ranking TR rises and conversely if the technical condition continues to deteriorate the TR falls. The TR of each individual ETF ranges from 0 to 50. The primary take away from this spread sheet should be the trend of the individual TRs either the continued improvement or deterioration, as well as a change in direction. Secondarily, a very low ranking can signal an oversold condition and conversely a continued very high number can be viewed as an overbought condition, but with due warning, over sold conditions can continue at apace and overbought securities that have exhibited extraordinary momentum can easily become more overbought. A sustained trend change needs to unfold in the TR for it to be actionable. The TR of each individual EM ETF in each of the three geographic regions can also reveal comparative relative strength or weakness of the technical condition of the select ETFs in the same region.
Last week The Total EM Technical Ranking or TEMTR rose by +16.69% to 737.5 from 632 the week before marking the fourth week of gains in the TEMTR. The Total Lat/AM EM Ranking rose the most of the three geographic regions by rising 37.7% to 140.5 from 102 two weeks ago. In second place was the Total EMEA EM Technical Ranking which rose 13.4% to 220 from 194. The Total Asia-Pacific EM Ranking rose 12.2% to 377 from 336.
The Total ETF Ranking (“TER”) Indicator is a total of all 20 ETF rankings and can be looked at as a confirmation/divergence indicator as well as an overbought oversold indicator. As a confirmation/divergence tool: If the broader market as measured by the iShares MSCI Emerging Markets Index ETF (EEM) continues to rally without a commensurate move or higher move in the TER the continued rally in the EEM Index becomes increasingly in jeopardy. Conversely, if the EEM continues to print lower lows and there is little change or a building improvement in the TER a positive divergence is registered. This is, in a fashion, is like a traditional A/D Line. As an overbought/oversold indicator: The closer the TER gets to the 1000 level (all 20 ETFs having a TR of 50) “things can’t get much better technically” and a growing number individual ETFs have become “stretched” the more of a chance of a pullback in the EEM. On the flip side the closer to an extreme low “things can’t get much worse technically” and a growing number of ETFs are “washed out technically”, a measurable low is close to being in place and an oversold rally will likely follow. The 13-week exponential moving average, in red, smooths the volatile TER readings and analytically is a better indicator of trend.
After months of non-confirmation of new recovery price highs in the EEM, last week the Total ETF Ranking registered the highest reading since January 2021 and in doing so, marked an unquestionable confirmation of last week’s recovery high from the 2022 lows. What follows is a second Weekly Chart and the technical comments that I made on social media yesterday…
The iShares MSCI Emerging Markets Index Fund or EEM caught a swift kick higher last week! That was thanks in part (see insert) to a sharp rally in the SPDR S&P Emerging Asia/Pacific ETF (GMF) members and in particular Chinese equities (well we all know what that was about) and a turn in the Lat/Am ETFs. Nonetheless the EEM overtook resistance at the 50% Internal Line (violet dashed line) of the Standard Pitchfork (violet P1 through P3) which had capped rally attempts twice before and closed the week just below resistance at the Upper Parallel of the Pitchfork (solid violet line). The EEM may have to retrace a portion of last week’s impulsive 3rd wave rally and even though it is currently overbought it appears that it is on its way to higher price levels and potentially resistance at the $50 level.
To receive the three unabridged ETF Studies that include the Market’s Compass U.S. Index and Sector Study, The Developed Market’s Country ETF Study, and the Emerging Markets Country ETF Study that track the technical condition of over 70 different ETFs and are published every Monday and the Market’s Compass Crypto Sweet Sixteen Study which is published every Sunday, become a paid subscriber at…
The charts are courtesy of Optuma whose charting software enables anyone to visualize any data including my Objective Technical Rankings.
For readers who are unfamiliar with the technical terms or tools referred to in the comments on the technical condition of the EEM can avail themselves of a brief tutorial titled, Tools of Technical Analysis or the Three-Part Pitchfork Papers that is posted on The Markets Compass website…
Listen here or on the go via Apple Podcasts and Spotify
Most investors look at REITs for yield, as bond-like, says Alex Pettee, who discusses the nuances and axioms of investing in the public and private side of real estate investment trusts with Brad Thomas and David Auerbach (1:50). Rates up, REITs down; ignore day-to-day movements (3:30). REIT valuations, property sectors and rate sensitivities (11:30). Common vs preferred shares (14:20). Bullish housing case intact? (16:00) Hurricane effects on real estate (21:00). 3 REITs worth looking at (24:10). This was originally published as a webinar on October 10.
Subscribe to iREIT + HOYA Capital
Transcript
Daniel Snyder: Hey everyone. Daniel Snyder here from Seeking Alpha. We’re going to go ahead and jump into this full hour with a powerhouse panel as you see here today.
We have David, we have Alex, we have Brad Thomas, all joining us from iREIT and Hoya Capital here on Seeking Alpha. I’ll go ahead and hand it off to you, David.
David Auerbach: I’m going to tee it up where, we’ll let Alex briefly give his background. Brad could share a couple of seconds of his background. We’re going to basically start top down, work our way through, go macro to micro.
So, Alex, with that, why don’t you give the folks here a quick 30-second background? Brad, give them a 30-second background, and then, we’ll start jumping right into it.
Alex Pettee: I’ve been writing on Seeking Alpha since 2015 under Hoya Capital. We’ve been focused on REITs. So, we cover every U.S.-listed REIT. There’s about 160 equity REITs, 40 mortgage REITs.
And I think it’s always kind of helpful just to kind of start off with a kind of REIT universe, but we’ll first start with Brad.
Brad Thomas: I’ve been on Seeking Alpha since 2010. Most of you probably know my story, but I’ve been here almost 15 years. I’m at 14 going on 15 years. During that time, I’ve been fortunate to start coverage on many different REITs, many of which have become S&P 500 companies today. We’ve seen a number of M&A transactions. We’ve seen a lot of these small-caps turn into some mid-caps and some big-caps.
So, it’s been great to be on Seeking Alpha and cover the REIT sector. And, again, I’m honored to have Alex and Dave really combine with iREIT. And we’re excited about the opportunities and giving investors the best REIT research really on the planet.
AP: Most investors look to REITs for yield. I think that that’s something we’ve kind of learned over time is that most investors aren’t as interested as us in the on the ground property level trends. It’s an income vehicle and so, REITs have kind of assumed that role as a bond-like vehicle. That comes with pros and cons.
The one negative side of it is the theme of the REIT rate correlation that REITs are very bond-like. REITs are “rates up, REITs down” trend.
And so, we’ll hit on what individual REITs are more rate sensitive, more economically sensitive. We’ll look at sorting REITs by market cap tiers. There’s very wide differences in dividend yield and in balance sheets, in large-cap, mid-cap, small-cap REITs. And then, we’ll hit on some of the trends, like on the private side, how that relates to REITs on the public side.
REITs are really very interesting because it’s the only kind of dual market where there’s a public side and there’s a private side. There’s two different valuations of these assets of the REITs, of the properties held in a REIT structure and on the private side.
And so, that also creates a lot of interesting trends that drive the creation of new REITs through IPOs, through spin-offs, et cetera, or the acquisition of existing REITs.
As of month end, the average equity REIT pays a dividend yield of 3.71%. Average mortgage REIT is north of 10%. One interesting thing here is that this is, of course, the cap-weighted yield, and we’ll go through this in a little bit, but this chart here is the breakdown of yield by cap size.
And you’ll see that large-cap REITs pay that sub-4% yield, but as you go down that cap tier, mid-cap, small-cap, that you do start to see 5%, 6% yields plus.
Dave, how about, like, we’ll kind of kick it off with kind of a “rates up, REITs down” discussion.
DA: Because of that strong employment report that we had last Friday, the acceleration of more Fed rate cuts going to the back half of the year has softened somewhat, maybe 25 basis points going in the rest of the year.
I think another problem that we’re seeing here is that as of this moment right now, the 10-year treasury is at 4.065%. Rates are above 4% for the first time in August. And so, again, with people so interest rate sensitive, yield sensitive, REITs have underperformed this week since the Fed rate cut came out.
And this is my opinion. This does not represent the views of Alex or Brad. When you buy REITs, you got to use 25-, 50-year type of lenses. Ignore the day-to-day movement of what’s going on in the sector. Focus on the year-to-year big picture. And the reason being, REITs are not day-traded vehicles.
If you want to buy a day-traded vehicle, go out and buy one of the hotel REITs because it’s a one-night contract. Then if you want to step it up, then you go into apartments, which are basically six months to one year contracts.
But if you look at the relationship of typical landlord to tenant, it’s five-plus year type of relationships that are in place. So, you can’t focus on the day-to-day headlines when you’ve got to look at things in a very big picture. That’s just my take, Alex.
DS: Can I jump in real quick? Everybody is, of course, reading about the interest rate cutting cycle that we’re in now.
Do you each possibly have an idea of where we’re going? Like, how far down do they continue to cut within the end of next year? Do you follow the dot plot maybe, or how do you calculate when you’re looking forward?
AP: The rate cut expectations, of course, peaked, the Friday after the September rate cut. At that time, the market was pricing in, I believe, about over five cuts for the year. So that would imply the jumbo in September, it was implying a jumbo in November, and then one in December. That’s come back significantly.
We’ve removed, basically, a full jumbo cut from the rate cut expectations. From about 4.85, which was last week, to about four cuts implied by year-end now.
Really since the end of the great financial crisis, REITs have been extremely interest rate sensitive. So from about 2010 or 2011 through COVID, that REITs were essentially trading as bond vehicles. The closest comparison I’d say to REITs is a corporate bond, a kind of a mid-tier corporate bond.
And so that correlation broke down early pandemic, but then really since the start of the Fed’s rate hiking cycle that “rates down, REITs up” or inverse has been a very strong correlation.
A very interesting trend here is that, so REITs were the single worst-performing equity sector from the start of the Fed’s rate hiking cycle, that was March 16, 2022. We’re the worst through this July.
As soon as we got that early pivot, the REIT sector was the best-performing equity sector from July through about last week, and then REITs have since underperformed. The accumulated underperformance peaked in June of this year at 45 percentage points.
Now that’s hugely historic. REITs have historically, on a 10, 15, 20, 25-year basis, basically matched S&P on an annual basis. So to get 45 percentage points of underperformance, that’s very significant.
REITs have outperformed by about 10% to 12%, from July until late September, but now, it’s back to about a 35%, 36% cumulative underperformance gap that REITs have versus S&P since the start of the Fed rate hiking cycle.
So, I think that it’s been a very, very tough couple years for REITs, the rate headwinds have been very strong. And I think the expectation is that same negative force is now positive.
And so it’s still very much at the mercy of the Fed, of market interest rates. I think that the easier path now is lower interest rates, and so that’s huge for the REIT sector.
DS: Thank you for that, Alex. And, Brad, I would love to hear from you because, I mean, you’re the legend, you’ve graciously given us so much time over the years doing all these webinars here on Seeking Alpha.
You had your start in the commercial space, right? You know the commercial side of it. We can go into all the different industries within the sector, but when I hear about interest rates being cut, and you think about, okay, well, they can refinance, and there’s been issues in the commercial space, is there any light at the end of the tunnel for them, if unemployment reports come in okay, job numbers are okay, people continue to spend, GDP continues to grow?
What if we don’t get all these cuts that the market is anticipating?
BT: Sure. Well, again, I think it goes back to not only just REITs, but any stock that would cover a publicly-traded company is we look at the cost of capital as a really big important metric to look for.
And within the REIT sector — again, I was a private developer for 25 years. I’m actually getting back into that business now as well on the private side. And the most of the private developers can’t compete with especially a lot of these big names.
We always talk about Realty Income, which is big popular name on Seeking Alpha, ticker symbol (O), or some of these bigger companies, Mid-America Apartments, ticker (MAA), both A-rated balance sheets.
So, we look at the cost of capital and how these publicly-traded companies have much better access to debt. And I think that’s what we’re really continuing to see.
Again, I’m seeing it now 14, 15 years here on Seeking Alpha, and I think we’ll continue to see a lot of these stronger companies, these blue-chip names, continue to grow their earnings and grow their dividends.
Through all of this, through COVID, even through great recession, we saw a number of these companies that were able to continue increasing dividend. So, I think now with this current setup that I think Alex just outlined, and great job, Alex, with that, I think we’ll continue to see maybe the rate cuts have softened a bit.
But even if they continue to soften, I mean, we’re still seeing those investment spreads. Again, those are the cap rates, minus the cost of capital, those margins continuing to sustain and grow. And so, I think that’s really important.
And the great thing about REITs, and I know we’re going to get into it here in this webinar talking about some sectors that we like, some sectors we don’t like, but the great thing about REITs today, again, as I’ve been on Seeking Alpha now 15 years, is now you have a much broader way to build portfolios and manage your risk. Certain sectors are going to grow quicker than other sectors.
Cell towers, data centers, none of that existed when I was a developer. There’s no way for the individual investor to have access to a data center or cell tower or cannabis REIT or a casino. So, now, there’s so many other opportunities to diversify and really define your risk tolerance levels and build these portfolios.
And again, the game is all about cost to capital and scale. I’ve written about this time and time on Seeking Alpha, but we really like those companies that are able to continue to grow their businesses, see those small-cap companies, we’re going to touch on some of those in a minute, turn to large-cap companies.
I think the setup is really attractive right now. Obviously, sentiment, as Alex just said, the last few years have really been brutal, but, again, we’re starting to see that rally.
And I think, we’ll still continue to have REITs rally, especially, again, those companies that have those wide moat advantages.
DS: David, Alex, maybe you want to start talking us through some of these sectors that we were planning to talk about today?
AP: Some REIT property sectors and even in those property sectors, the individual REITs, there’s a very wide range of rate sensitivity, of economic sensitivity.
What the investor should expect at the property sector level, of what they’re investing in. Is this REIT extremely rate sensitive? Is this a bond-like vehicle, or is this more of an equity stock-like vehicle?
And then also to what degree that these REITs are good inflation hedges. That typically corresponds with rates, but there are some REITs that are not particularly rate sensitive, but are good hedge vehicles.
So, healthcare REITs, very rate sensitive. Storage REITs, very rate sensitive, very bond-like. Where on the other side of it, you have mall REITs, billboards, these are not rate sensitive. And so, I think that from a portfolio management standpoint, what we basically try to do is try to balance these trends, so we’re not making a direct call on interest rates that are not entirely bond-like.
That leads to an interesting discussion on REIT valuations. And so, obviously, what we’ve seen at this REIT rebound since early July, for the first time since about mid-2021, that REITs are now trading at NAV premiums. And this is important from that kind of first point that I talked about in this dual market structure, right?
There’s a private real estate industry, and there’s a public real estate industry. And a lot of the flow between new REIT creations and REITs being acquired is driven by this NAV premium. So, what NAV basically is, it’s: are the real estate assets held by these REITs more valuable in the REIT structure or less valuable in the REIT structure?
When they’re more valuable at the REIT sector level that the flow is into public REITs, that there’s new REITs being created, there’s private entities that are launching REITs. And when this is a NAV discount that the flow is out, that there’s more acquisitions, because you can basically buy the same private property in a REIT structure for cheaper than going out.
And so, yes, what we’ve seen the last couple of years is this net outflow of REITs being taken private. In 2021, there was about 215 REITs. There’s now about 195.
So one interesting factor with REITs is that the valuations play a meaningful role in how REITs actually operate, that the stock price actually matters from an operational standpoint.
And it all ties back to the cost of capital issue, and that REITs actually perform their best when capital is relatively cheaper. So when REITs are trading at discounts, you really don’t get much activity. It’s hard to grow externally.
DS: Some REITs have common versus preferred shares. So the question is, how do you approach which asset class you would kind of choose for any individual REIT?
AP: So we also track all of the REIT preferreds, 174 individual REIT preferred stocks. The average yield on these is about 7.9%, right? So there is a significant yield premium on the REIT preferreds.
BT: Not every REIT, of course, has preferreds. I’ll recommend, and I don’t know about some of those on the team, but I like to have a small percentage of those, kind of as Alex pointed out, as yield enhancers. I like around 10%, 20%, but, again, everybody has got their own risk tolerance level.
And a lot of these companies do have issued preferred, but not all, and there are some really attractive preferreds as well. So, anyway, hopefully, that answers that question.
And there’s actually a couple preferred REIT ETFs that all they do is just invest in REIT preferreds, and that may be another angle as well.
AP: Since 2019, the REIT common has outperformed the REIT preferreds. It definitely is kind of a different type of vehicle. It’s certainly much more yield focused.
Essentially, all of the REIT preferreds are cumulative, and so it’s very rare to kind of have major distribution issues. There have been a handful of cases where the preferred dividend cut as part of a acquisition, right? So, that’d be Cedar (CDR.PR.B) and the Wheeler (WHLR) situation.
But the vast majority of REIT preferreds stayed current on their distribution throughout COVID, and all except, I believe, the Wheeler and the Cedar are now current on their preferreds.
DS: So, I want to go ahead and steer the ship a little to a different industry. Brad, you mentioned cell towers and there’s industrials and data centers and all these other ones, but I think the one that always comes to the top of mind when people talk about real estate is they think about their home.
They think about the consumer. They think about how interest rates are affecting the consumer. So, in the mortgage industry, could you give us a lay of the land and maybe what you’re looking at housing when it comes to maybe even private equity companies are going in there and kind of adjusting some values and things like that, what are we seeing within mortgage, multifamily, and that sort of area?
AP: Yeah, I think that housing theme has always been kind of our major focus. I think that was kind of, like, when we started publishing here in late 2010s, housing was what we saw as the most compelling kind of macro real estate theme.
What was driving this was post great financial crisis, this essentially near shutdown of new construction. So, you saw historically low levels of new construction starting in about 2010, and that kind of built up this significant housing shortage. And I think, in 2018, 2019, that term “housing shortage” was not used often, right? It wasn’t in the daily conversation as it is now.
What we are basically forecasting is that this underbuilding was basically coming in front of this big wave, right? So, I guess, it’s Gen Z or the largest age cohort today is that 30- to 36-year-old age cohort. And so, back in 2018, 2019, we kind of saw this as being the significant catalyst, right? There were this clash of high demand and historically low supply.
And, of course, what we didn’t forecast when we’re making these calls in 2018, 2019 was how COVID would kind of accelerate these trends. And instead of playing out over 10, 15 years, it basically played out in a six month to 18 month time period where you had all this housing demand clashing with this historically low housing supply.
I think that bullish housing case is still intact. And I think that what goes on the housing side, also on the commercial side, it’s all about the supply side is really, I think, where really the area to kind of focus on, right?
The supply takes years and years to kind of build, and in many cases in some property sectors that there’s structural constraints to new supply. On the single family side, of course, there’s zoning, et cetera, that creates these barriers to new supply growth.
And so, those are, I think, if you look at the outperforming commercial sectors you’ll find that the supply theme is really the overriding trend and that the serial outperformers tend to be those not with necessarily high demand, but it’s that supply constraints.
And it’s kind of functioning in that Goldilocks zone where it’s not robust enough that the prices get bid up, that there’s a lot of new construction. But it’s the kind of sectors that are under the radar, so aren’t getting huge supply growth, but can outperform just kind of based on that — those structural trends.
DS: Brad, I wanted to see, do you have a thought about this whole mortgage and, specifically, I mean, the people out there obviously trying to still buy homes. There’s not enough, as he’s mentioned with the supply. I mean, do you see any light at the end of the tunnel here? Is that what keeps the wheel going?
BT: I think, again, there’s a couple angles here. One, and great job, again, Alex, on the mortgage REIT side, again cover residential and commercial mortgages. And the residential REIT side is certainly an interesting sector.
It’s one that – and I’ve wrote about this quite a bit. I’m not a huge fan of residential mortgage REITs. They’re a lot higher levered than equity REITs, and they’re really not suitable – for the large part, they’re not suitable for many retirees, which is a big part of our following, our base.
Not to say you shouldn’t invest in residential mortgage REITs. There’s some really interesting preferreds, which are much safer than the common of the mortgage, set aside.
Now, on the commercial side, I do like that space. I like it for a couple of reasons. One is, it gives us, as a research team, a lot more insight into commercial real estate. I have regular discussions with CEOs and family office investors about commercial real estate.
One of the CEOs that I interview frequently, in fact, maybe this week, I hope, is Brian Harris, who’s the CEO of Ladder Capital (LADR). They’re a specialty mortgage REIT. Brian’s got deep, deep, deep experience in commercial mortgage REITs, and that really has helped us and our team develop strategies around the equity side, because we like to see where is the pain and where are the opportunities, and it’s good to hear from these bankers who really know that space pretty well.
So, I like the mortgage space, but specifically, for me, I like commercial mortgage REITs.
Now, on the equity side, there’s a lot of ways to play it. As I said, we’ve got an evolution of property sectors now, not just apartments. We like apartments and, specifically, I like Sunbelt markets.
Now, that being said, we got another hurricane. My prayers go out to all of you. We just went through a major, major one here in South Carolina, still going to recover, it’s going to take weeks and months.
And there are REITs that own apartments right here in my backyard. Mid-America, for example, 10 communities in the Greenville, Spartanburg, South Carolina market. Now, those appear to be fine, as far as I can tell. We didn’t get hit terribly bad.
But the point I’m trying to make here is, multifamily, not just multifamily REITs, Daniel, but we have the manufactured housing REITs. And, again, I’m worried about some of those portfolios down in Florida.
I mean, Florida is going to get some pretty severe property damage, but there’s a sector that I really like. It’s driven obviously by the aging silver tsunami, like we like to refer to it. So, that’s another angle to play housing, affordable housing. And those are just ground leases, by the way, essentially for the large part. So, that’s one other angle.
You have skilled nursing, is another angle, and senior housing is another angle. So, there’s many ways to play kind of the housing environment. And for me, I really still like the Sunbelt multifamily in Mid-America, Camden Property Trust (CPT). I just wrote on Camden, I believe, yesterday. So, I think those are the kind of angles whether you’re going to be a renter or an owner.
The residential mortgage space, yes, there’s certainly some opportunities, but I’ll lean a little safer. And historically, those companies don’t pay out growing dividends. There is a very volatile dividend environment for the residential mortgage REITs, which is why I’ve kind of shifted from that.
And then, of course, Alex mentioned home builders. I mean, his firm has done a lot of work on the home builder space. They’ve got this ETF called (HOMZ), which invests in the broader housing sector. But these home builders, I mean, Toll Brothers (TOL), Pulte (PHM), I just wrote on those builders yesterday.
Anyway, there are a lot of ways to play it, but I think in the REIT space, again, that’s the opportunity for REITs, because you can really design or customize your portfolio based on your risk tolerance.
But I do think Alex is right, that supply is certainly what you need to watch for, and I think that’s how you’re going to make your money in the residential or the mortgage space.
DS: Thank you so much, Brad. Now, a quick question for you. I know we have three stocks that we’re going to cover here in just a second. We’ll kind of do a little bit of a rapid fire with those.
But there was a question that came through, because we’ve been talking about preferreds. You just mentioned ETFs. Somebody asked, is there an ETF that really just holds those preferred shares that comes to your mind that you really like to keep an eye on?
BT: (PFF) or (PFFA), and Alex, you and I may be thinking the same thing, but those are the two tickers I like.
AP: Yeah.
DS: All right. So, let’s go ahead and dive into these three stocks. Let’s start talking about we’ve been talking about a bunch of different industries and sectors, and these kind of go over three different industries as well, I believe. Brad, this is your article, that I kind of pulled from the iREIT and Hoya service. So, maybe you want to kick us off with the first name?
BT: Talking about small caps. So, I think there’s a great opportunity. Again, we were just talking about rate cuts and even in these small caps, I think, we’ll get more of a boost with these rate cuts.
And so, I’ll just pick the first one, Alpine Net Lease (PINE). Alpine launched by way of another REIT, called — it used to be called Consolidated-Tomoka. I can’t pronounce it. Now they call themselves CTO Realty. They’re also based down in Florida, in Orlando or Daytona Beach. They spun-off their net lease properties.
CTO spun off their net lease properties into another REIT called Alpine Net Lease, and the ticker symbol is PINE. It’s one of the smaller net lease REITs. Many of you know, I love net lease REITs, and I love net lease real estate. I used to build a lot of it.
And it’s just the most boring property sector it is. 15-year long-term leases, modest rent bumps, but it’s a very stable and predictable and reliable property sector. Alpine fits right into that box. They have these long-term net lease properties that are much smaller. Again, they’re a small cap company.
I’ve looked for the company to be acquired. I think it could be potentially a takeover target. I think there’s value. CTO owns a percentage. I can’t remember exactly, but a percentage is of Alpine. So, I think there’s certainly an opportunity for CTO. They’re externally managed as well. So, Alpine is managed by CTO.
I think there’s an opportunity for Alpine to get acquired by a company like Realty Income or maybe Agree Realty, ticker (ADC), or even a private company like Blackstone (BX).
Again, small portfolio, but I think the value there could be unlocked potentially for CTO, the external manager, because they could reinvest that capital at much higher yields than they’ve got within their Alpine portfolio. So I like that name a lot.
DA: Too small for Realty Income. They’re not going to be the buyer. My opinion.
BT: I would say, they’ve obviously, Spirit and VEREIT were two bigger acquisitions by Realty Income, and certainly that hasn’t moved the needle. I think the market has really missed the opportunities.
But, look, Realty Income is the aggregator. Since we’re on that subject, I mean, Realty Income is the aggregator of choice. They’re going to continue to grow that business model, and obviously, they’re entering Europe.
But I would say, Dave, you may be right, but I would say also never say never. I think, they’re still buying smaller portfolios, but given the composition of that Alpine portfolio, you’re probably right. It’s probably more about a private buyer for that portfolio than Agree.
I’ve talked to Joey, the CEO of Agree, quite a bit. I agree with you on that Dave as well. I think Joey probably has no interest in M&A and he hasn’t done a whole lot of M&A. But I do believe Realty Income will continue to be active.
And look, who knows? I mean, they have the ability to do a reverse merger in National Retail Properties, or (NNN) REIT. So, Realty Income has got certainly something nobody else has, which is the ability to transact these very large multibillion-dollar transactions.
DS: Yeah, it seems like they continue to get bigger and bigger every month.
DA: Hey, Daniel, before we can go ahead real quick, I have over 50 questions that we’ve gotten in this conversation today. I’ve taken every single question that’s come in the chat. I’m compiling a list for everybody that’s on this. We are going to answer every single one of these questions.
DS: I think you just earned yourself about 20 more emails right there.
All right, so this next one kind of surprised me. I never really thought about it, but the U.S. Post Office in that angle, what’s this next name, Brad?
BT: Postal Realty (PSTL). Postal is an interesting company. Again, they own one tenant in their portfolio, which is U.S. Postal Service. Look, I don’t know about you, but I think, I still go to the mailbox every day and I don’t pay as many bills through the post office, but I do believe the post office is sustainable.
I think the post office could be utilized better and we should have maybe hunting and fishing licenses at post offices and could increase their business activities. However, that’s a very stable business model, in my opinion.
I don’t think the government is going to let the post office go away anytime soon. I think it’s a bipartisan pick, by the way. And so, I like the post office. I think this is a really interesting category and Dave, there’s another one that actually ties perfectly into something Dave and I’ve been talking about another government pure play kind of government play, but postal is definitely one that we like.
The company has the ability to continue to grow their business model. Having that relationship with the U.S. Postal Service is certainly a competitive advantage. I used to own a few post offices myself, and again, they’re very reliable tenants and typically they don’t close many of these locations. So, I think that’s a great business model. Again, you’re looking at kind of a government-like entity.
So, Dave, I think you had another one. I don’t know if you want to talk about it here, just really quickly on your other government pick.
DA: Yeah, my pick that I seem to like, and I’ve mentioned it at frequent Seeking Alpha events is Easterly Government Properties. The ticker is (DEA). It is not your typical office REIT as it does focus on government agencies, the FBI, your TSA local field offices, Department of Veterans Affairs, et cetera. What’s the word I’m looking for, it has no impact on what’s going on with the election.
If you think about whoever is running, whoever is the President, they are not going to be closing FBI field offices as an example, or TSA is going away anytime soon. So, I mean, I hate to say it, but it’s just a very boring, slow and steady long-term lease type of company that’s very different than every other office REIT that’s out there.
DS: Brad, let’s go with this third one. Why don’t you walk us through it?
BT: The last one is actually, I think, turned into a fairly popular name here on Seeking Alpha, and it’s the cannabis space, and it’s not (IIPR). IIPR is Innovative Industrial Properties.
Interesting fact, that’s the only cannabis REIT listed on the New York Stock Exchange. They were able to get in before the window closed. Got that listing. But you’re not going to see, at least in the short term, any New York Stock Exchange listed cannabis REITs, in my opinion.
NewLake Capital Properties, (OTCQX:NLCP), what they’ve been able to do is go over the counter. The management is talking about other ways to list, but that’s one risk you’re going to take over the counter. Again, they’re smaller cap name. But I like the company a lot, or we like the company a lot. We’ve interviewed the management team quite a bit. They’re certainly experienced.
I got to know this company through one of the Board members. In fact, the Chairman of the Board is Gordon DuGan. Gordon was formerly the CEO of W.P. Carey (WPC), and that’s where I got to know Gordon. He’s got a lot of experience in the net lease space, being at W.P. Carey for as long as he was, and now being involved with NewLake Capital Properties.
So, that company, we believe, has got a really good business model, very low levered company, and we think a pretty sustainable dividend.
Obviously, the cannabis sector is extremely volatile and there’s still fact that there’s no federalization in the space. So, it’s all kind of state by state. We’re seeing a growing number of states still adopt cannabis legislation. Maybe South Carolina at some point will get it, which is probably one of the most conservative states we have here.
But I like NewLake Capital Properties. I think really good management team, really solid fundamentals. Again, there’s risk. It’s over the counter and it’s a cannabis play.
DS: All right, Alex, I got to ask you, if you’re backed into a corner, you got to give us one stock, which one comes to mind?
AP: Probably something in the housing space. I still like the single-family rental REITs. I think that there’s such structural undersupply there. On the multifamily side, there is more supply. Although on the multifamily side, like, the bear case for the last eight or nine years has always been oversupply, oversupply.
And I think that that goes to the point earlier in that the demand side has kind of met that supply. But I think that this Gen Y, right, that this is now in multifamily markets, but now kind of aging out of multifamily. So, I think, there’s only two REITs in this space, (INVH) and (AMH), right?
But I think that over three-, five-plus years, I think that that undersupply and this Gen Y coming through, that is a huge structural tailwind for the space.
DS: I got to say because now it’s easy to say, oh, well, somebody asked me something about REITs, just go to you guys. The CEO interviews, all the analysts on your team, I mean, the customer support and service that you guys give is far above anything else I’ve seen. So, I just want to say thank you from my side of things. It makes it really easy.
And then also, I want to mention, I’ve seen questions come in today, people asking about taxes and all sort of things. I mean, if you guys have those questions, these are the guys to ask them to. You can do that within the service here on Seeking Alpha as well. I mean, these guys offer a lot of just free information a lot of the times, too, because they’re so nice.
I can’t thank you enough all for your time and knowledge today. So go ahead and check out iREIT + Hoya Capital.
Editor’s Note: This article discusses one or more securities that do not trade on a major U.S. exchange. Please be aware of the risks associated with these stocks.
You might be considering a house in Indianapolis or an apartment in Louisville, as both cities offer distinct living experiences. Indianapolis provides more affordable living and a relaxed, Midwestern pace, while Louisville offers a blend of Southern culture and vibrant urban life. Whether you’re drawn to the open spaces and suburban feel of Indianapolis or the historic charm and lively atmosphere of Louisville, choosing the right place to call home is a big decision.
From real estate prices and job prospects to cost of living and cultural experiences, there’s a lot to consider. In this Redfin article, we’ll explore the key differences to help you determine which city is best for your next move.
Housing in Indianapolis vs Louisville
Housing in Indianapolis
Indianapolis offers a variety of housing options, from suburban neighborhoods to urban downtown apartments. Homebuyers will find affordable single-family homes with larger lots, particularly in suburban areas like Carmel, Fishers, or Greenwood. Indianapolis’ housing market is known for its spacious living compared to many urban regions, making it appealing for families and those seeking a quieter lifestyle with access to city amenities.
Housing in Louisville
Louisville’s housing market offers a mix of urban, suburban, and historic living. Buyers can choose from charming Victorian homes in Old Louisville to modern condos in downtown areas. The city’s mix of green spaces and culturally Louisville neighborhoods makes it an attractive option for homebuyers and renters alike. Louisville is still relatively affordable, though housing prices have risen in recent years due to growth in demand.
Cost of living in Indianapolis vs Louisville
The overall cost of living in Louisville is about 5% higher than in Indianapolis, driven primarily by differences in housing, utilities, and lifestyle expenses.
1. Utilities
Utilities in Louisville are about 11% less expensive than in Indianapolis. While Louisville’s larger population and older infrastructure might drive up utility use, Indianapolis benefits from more modern, energy-efficient buildings, which can keep utility costs higher despite the city’s infrastructure being newer.
2. Groceries
Grocery costs in Louisville are approximately the same as in Indianapolis. Louisville’s urban demand for diverse food options keeps prices similar to Indianapolis, which benefits from its proximity to agricultural regions that help keep food prices stable.
3. Transportation
Transportation costs are roughly the same in both Indianapolis and Louisville. While Louisville offers a more developed public transit system and higher parking fees in urban areas, Indianapolis remains more car-dependent, but both cities have similar commuting costs overall.
4. Healthcare
Healthcare in Louisville is around 30% more expensive than in Indianapolis. Louisville’s broader range of specialized medical services contributes to higher healthcare costs, while Indianapolis provides more budget-friendly options with fewer specialized healthcare facilities.
5. Lifestyle
Lifestyle costs in Louisville are about 10% higher than in Indianapolis due to the city’s vibrant arts scene, dining, and entertainment options. Indianapolis offers similar cultural experiences, though at a more affordable price, making it attractive for those seeking a lower-cost urban lifestyle.
Indianapolis vs Louisville in size and population: A tale of two distinct cities
Indianapolis and Louisville, while geographically close, differ significantly in size and population. Indianapolis covers about 370 square miles with a population of roughly 888,000, offering a mix of urban and suburban living. The city has a bustling downtown and sprawling suburbs, with more space for parks and residential areas. In contrast, Louisville spans around 400 square miles with a population of about 387,000, creating a more compact, urban atmosphere. While Indianapolis provides more open space and a quieter lifestyle, Louisville’s dense urban environment offers quicker access to cultural events and activities.
Weather and climate in Indianapolis vs Louisville
Both Indianapolis’ climate and Louisville’s climate experience all four seasons, with hot, humid summers and cold winters. However, Indianapolis tends to have harsher winters, with more frequent snowstorms, particularly in northern parts of the city. Louisville, being farther south, enjoys milder winters with more rain and less snow. Both cities experience similar summer heat and humidity, but Louisville often has longer, warmer summers. Severe thunderstorms and tornadoes can affect both areas, though Indianapolis’ colder winters and Louisville’s longer summers mark the primary climate differences.
The Job Market in Indianapolis vs Louisville
Indianapolis: A diverse economy rooted in manufacturing and healthcare
Indianapolis has a strong job market driven by manufacturing, healthcare, and tech. The city’s employment rate is around 66%, with a median household income of about $67,000. Key industries include pharmaceuticals, logistics, and tech, with major employers like Eli Lilly, Salesforce, and Cummins offering a range of job opportunities. With an average hourly wage of $29.11, Indianapolis provides competitive wages in sectors like healthcare, tech, and education.
Louisville: A growing hub for healthcare and logistics
Louisville’s job market is centered around healthcare, logistics, and manufacturing, with UPS Worldport being one of the city’s largest employers. The employment rate in Louisville is about 60%, with a median household income of $62,000. The average hourly wage in Louisville is $27.87, reflecting the city’s more affordable cost of living. Healthcare giants like Humana and Norton Healthcare, as well as a growing tech sector, contribute to Louisville’s diverse job market.
Transportation in Indianapolis vs Louisville
Indianapolis: Car-dependent with limited public transit
Indianapolis is largely car-dependent, with most residents relying on personal vehicles for commuting. Public transportation is limited, though IndyGo provides bus services throughout the city. The expansive highway system around Indianapolis makes driving a convenient option, but outside of downtown, biking and walking are less common. The city has made some efforts to expand bike lanes and pedestrian-friendly areas, particularly downtown, but for the most part, Indianapolis remains reliant on cars.
Louisville: Growing transit with car-friendly options
Like Indianapolis, Louisville is predominantly car-dependent. The city’s transportation system includes bus services through the Transit Authority of River City (TARC), but many residents still rely on personal vehicles for their daily commute. Louisville is more walkable in its downtown and historic neighborhoods, and it has made strides in creating bike-friendly infrastructure through programs like the LouVelo bike share. Compared to larger cities, Louisville offers more ample parking options, making driving the primary mode of transportation for many.
Travel in and out of Indianapolis vs Louisville
Both cities offer significant travel connections, although Louisville has a more centralized airport hub for international flights. Indianapolis provides a range of travel options, including an international airport, major highways, and Amtrak service, making it easy to travel in and out of the city.
Indianapolis: Indianapolis International Airport, Amtrak routes, Greyhound services, and extensive highway connections.
Louisville: Louisville Muhammad Ali International Airport, Amtrak access via nearby cities, Greyhound, and Megabus services.
Lifestyle and things to do in Indianapolis vs Louisville
A day in the life of an Indianapolis resident
Living in Indianapolis offers a blend of suburban comfort and urban excitement. Mornings might begin with a coffee at a local café in the Broad Ripple neighborhood, or for those in the suburbs, a quiet start to the day on the porch. Downtown Indianapolis brings a mix of bustling streets and peaceful green spaces, providing residents with easy access to both work and leisure. Weekends are spent enjoying local farmer’s markets, attending Colts games at Lucas Oil Stadium, or exploring the city’s arts scene. Outdoor enthusiasts often head to nearby parks for a hike or bike ride, while the city’s many cultural attractions offer endless entertainment options.
Top things to do in Indianapolis:
Google Street View inside the Indianapolis Museum of Art
Indianapolis parks and green gems:
\
Google Street View of agle Creek Park
Indianapolis tourist attractions:
Indianapolis Motor Speedway
The Indiana State Museum
Indianapolis Zoo
White River State Park
The Eiteljorg Museum of American Indians and Western Art
A day in the life of a Louisvillian
Life in Louisville is a blend of Southern charm and urban excitement. Mornings might begin with a cup of bourbon coffee at a local café, followed by a stroll through historic neighborhoods like Old Louisville. Weekends are for exploring the lively food scene, attending one of the many festivals, or taking a walk along the scenic Ohio River. Outdoor enthusiasts enjoy walking through Waterfront Park or visiting one of the city’s many parks, while those looking for entertainment can take in a performance at the Kentucky Center or catch live music at a local bar.
Top things to do in Louisville:
Google Street View of the Louisville Slugger Museum & Factory
Louisville parks and green gems:
Google Street View of the Waterfront Park
Louisville tourist attractions:
Churchill Downs
Kentucky Science Center
Louisville Mega Cavern
Louisville Zoo
Belle of Louisville Riverboats
Food and culture in Indianapolis vs Louisville
Indianapolis: A taste of heartland comfort
Indianapolis boasts a food scene that combines traditional Midwestern comfort with modern culinary innovation. Known for its iconic pork tenderloin sandwiches and sugar cream pie, the city embraces its agricultural roots while offering a growing selection of diverse dining options. Indianapolis has seen a rise in farm-to-table restaurants and an expanding craft beer movement, with local breweries becoming a staple in neighborhoods like Fountain Square and Broad Ripple. The city’s cultural identity is also deeply connected to sports and racing, with the Indianapolis 500 serving as a yearly highlight. Festivals, state fairs, and local events bring the community together, showcasing everything from artisan foods to live music. Whether you’re enjoying a laid-back meal or exploring the city’s evolving food landscape, Indianapolis offers a warm, welcoming taste of Midwestern comfort.
Louisville: Bourbon, barbecue, and the Kentucky Derby
Louisville’s food scene offers a unique blend of Southern charm and Midwestern influence, with bourbon-infused dishes and classic Southern fare like hot browns and fried chicken. The city is part of the famed Kentucky Bourbon Trail, drawing food and drink lovers from across the country. Louisville’s neighborhoods, such as the Highlands, are home to a variety of culinary experiences, from fine dining to vibrant food trucks. In addition to its food scene, Louisville is known for the Kentucky Derby, a world-renowned cultural event that combines horse racing with elaborate hats, mint juleps, and parties. The city also boasts a thriving arts scene, with festivals, theater, and live music filling the calendar year-round.
Sports scene in Indiana vs Louisville
Indianapolis: A basketball and motorsports powerhouse
Indianapolis is synonymous with sports, especially basketball and motorsports. Known as a basketball hub, the city is home to the Indiana Pacers, offering an exciting NBA experience at Gainbridge Fieldhouse, and the passion for basketball extends throughout the state with deep roots in high school and college teams. Hoosier basketball culture thrives here, bringing communities together. Indianapolis is also the proud host of the iconic Indianapolis 500, the world’s largest single-day sporting event, drawing motorsports fans from all over the globe to the Indianapolis Motor Speedway every May. Beyond basketball and racing, football is a major part of the city’s sports identity, with the Indianapolis Colts playing at Lucas Oil Stadium.
Louisville: Horse racing and college basketball pride
Louisville’s sports scene is best known for the Kentucky Derby, an iconic event that draws international attention every May. Churchill Downs serves as the heart of horse racing culture in Louisville. The city also has a strong basketball presence, with the University of Louisville Cardinals competing at the highest levels of NCAA basketball. Football is also popular, with college and minor league teams contributing to the city’s sports identity. Louisville Slugger Field offers baseball fans the chance to see the Louisville Bats, a Triple-A affiliate of the Cincinnati Reds, in action.
Last Wednesday (August 28), the market waited with bated breath for Nvidia’s earning call, scheduled for after the market closed. That call, at first sight, contained exceptionally good news, with revenues and earnings coming in at stratospheric levels, and above expectations, but the stock fell in the aftermath, down 8% in Thursday’s trading. That drop of more than $200 billion in market capitalization in response to what looked like good news, at least on the surface, puzzled market observers, though, as is their wont, they had found a reason by day end. This dance between companies and investors, playing out in expected and actual earnings, is a feature of every earnings season, especially so in the United States, and it has always fascinated me. In this post, I will use the Nvidia earnings release to examine what news, if any, is contained in earnings reports, and how traders and investors use that news to reframe their thinking about stocks.
Earnings Reports: The Components
When I was first exposed to financial markets in a classroom, I was taught about information being delivered to markets, where that information is processed and converted into prices. I was fascinated by the process, an interplay of accounting, finance and psychology, and it was the subject of my doctoral thesis, on how distortions in information delivery (delays, lies, mistakes) affects stock returns. In the real world, that fascination has led me to pay attention to earnings reports, which while overplayed, remain the primary mechanism for companies to convey information about their performance and prospects to markets.
The Timing
Publicly traded companies have had disclosure requirements for much of their existence, but those requirements have become formalized and more extensive over time, partly in response to investor demands for more information and partly to even the playing field between institutional and individual investors. In the aftermath of the great depression, the Securities Exchange Commission was created as part of the Securities Exchange Act, in 1934, and that act also required any company issuing securities under that act, i.e., all publicly traded firms, make annual filings (10Ks) and quarterly filings (10Qs), that would be accessible to investors.
The act also specifies that these filings be made in a timely manner, with a 1946 stipulation the annual filings being made within 90 days of the fiscal year-end, and the quarterly reports within 45 calendar days of the quarter-end. With technology speeding up the filing process, a 2002 rule changed those requirements to 60 days, for annual reports, and 40 days for quarterly reports, for companies with market capitalizations exceeding $700 million. While there are some companies that test out these limits, most companies file well within these deadlines, often within a couple of weeks of the year or quarter ending, and many of them file their reports on about the same date every year.
If you couple the timing regularity in company filings with the fact that almost 65% of listed companies have fiscal years that coincide with calendar years, it should come as no surprise that earnings reports tend to get bunched up at certain times of the year (mid-January, mid-April, mid-July and mid-October), creating “earnings seasons”. That said, there are quite a few companies, many of them high-profile, that preserve quirky fiscal years, and since Nvidia’s earnings report triggered this post, it is worth noting that Nvidia has a fiscal year that ends on January 31 of each year, with quarters ending on April 30, July 31 and October 31. In fact, the Nvidia earnings report on August 28 covered the second quarter of this fiscal year (which is Nvidia’s 2025 fiscal year).
The Expectations Game
While corporate earnings reports are delivered once a quarter, the work of anticipating what you expect these reports to contain, especially in terms of earnings per share, starts almost immediately after the previous earnings report is delivered. In fact, a significant portion of sell side equity research is dedicated to this activity, with revisions made to the expected earnings, as you get closer and closer to the next earnings report. In making their earnings judgments and revisions, analysts draw on many sources, including:
The company’s history/news: With the standard caveat that the past does not guarantee future results, analysts consider a company’s historical trend lines in forecasting revenues and earnings. This can be augmented with other information that is released by the company during the course of the quarter.
Peer group reporting: To the extent that the company’s peer group is affected by common factors, it is natural to consider the positive or negative the operating results from other companies in the group, that may have reported earnings ahead of your company.
Other analysts’ estimates: Much as analysts claim to be independent thinkers, it is human nature to be affected by what others in the group are doing. Thus, an upward revision in earnings by one analyst, especially an influential one, can lead to revisions upwards on the part of other analysts.
Macro news: While macroeconomic news (about the economy, inflation or currency exchange rates) cuts across the market, in terms of impact, some companies are more exposed to macroeconomic factors than others, and analysts will have to revisit earnings estimates in light of new information.
The earnings expectations for individual companies, from sell side equity research analysts are publicly accessible, giving us a window on trend lines.
Nvidia is one of the most widely followed companies in the world, and most of the seventy plus analysts who publicly follow the firm play the estimation game, leading into the earnings reports. Ahead of the most recent second quarter earnings report, the analyst consensus was that the company would report revenues of $28.42 billion for the quarter, and fully diluted earnings per share of 64 cents; in the 30 days leading into the report, the earnings estimates had drifted up mildly (about 0.1%), with the delay in the Blackwell (NVidia’s new AI chip) talked about but not expected to affect revenue growth near term. It is worth noting that not all analysts tracking the stock forecast every metric, and that there was disagreement among them, which is also captured in the range on the estimates; on earnings per share, for instance, the estimates ranged from 60 to 68 cents, and on revenues, from $26 to $30 billion.
The pre-game show is not restricted to analysts and investors, and markets partake in the expectations game in two ways.
Stock prices adjust up or down, as earnings expectations are revised upwards or downwards, in the weeks leading up to the earnings report. Nvidia, which traded at $104 on May 23rd, right after the company reported its results for the first quarter of 2024, had its ups and down during the quarter, hitting an all-time high of $135.58 on June 18, 2024, and a low of $92.06, on August 5, before ending at $125.61 on August 28, just ahead of the earnings report:
During that period, the company also split its shares, ten to one, on June 10, a week ahead of reaching its highs.
Stock volatility can also changes, depending upon disagreements among analysts about expected earnings, and the expected market reaction to earnings surprises. That effect is visible not only in observed stock price volatility, but also in the options market, as implied volatility. For Nvidia, there was clearly much more disagreement among investors about the contents of the second quarter earnings report, with implied volatility spiking in the weeks ahead of the report:
While volatility tends to increase just ahead of earnings reports, the surge in volatility ahead of the second quarter earnings for Nvidia was unusually large, a reflection of the disagreement among investors about how the earnings report would play out in the market. Put simply, even before Nvidia reported earnings on August 28, markets were indicating more unease about both the contents of the report and the market reaction to the report, than they were with prior earnings releases.
The Event
Given the lead-in to earnings reports, what exactly do they contain as news? The SEC strictures that companies disclose both annual and quarterly results have been buffered by accounting requirements on what those disclosures should contain. In the United States, at least, quarterly reports contain almost all of the relevant information that is included in annual reports, and both have suffered from the disclosure bloat that I called attention to in my post on disclosure diarrhea. Nvidia’s second quarter earnings report, weighing in at 80 pages, was shorter than its annual report, which ran 96 pages, and both are less bloated than the filings of other large market-cap companies.
The centerpieces of the earnings report, not surprisingly, are the financial statements, as operating numbers are compared to expectations, and Nvidia’s second quarter numbers, at least at first sight, are dazzling:
The company’s astonishing run of the last few years continues, as its revenues, powered by AI chip sales, more than doubled over the same quarter last year, and profit margins came in at stratospheric levels. The problem, though, is that the company’s performance over the last three quarters, in particular, have created expectations that no company can meet. While it is just one quarter, there are clear signs of more slowing to come, as scaling will continue to push revenue growth down, the unit economics will be pressured as chip manufacturers (TSMC) push for a larger slice and operating margins will decrease, as competition increases.
Over the last two decades, companies have supplemented the financial reports with guidance on key metrics, particularly revenues, margins and earnings, in future quarters. That guidance has two objectives, with the first directed at investors, with the intent of providing information, and the second at analysts, to frame expectations for the next quarter. As a company that has played the expectations game well, it should come as no surprise that Nvidia provided guidance for future quarters in its second quarter report, and here too, there were reminders that comparisons would get more challenging in future quarters, as they predicted that revenue growth rates would come back to earth, and that margins would, at best, level off or perhaps even decline.
Finally, in an overlooked news story, Nvidia announced that it would had authorized $50 billion in buybacks, over an unspecified time frame. While that cash return is not surprising for a company that has became a profit machine, it is at odds with the story that some investors were pricing into the stock of a company with almost unlimited growth opportunities in an immense new market (AI). Just as Meta and Alphabet’s dividend initiations signaled that they were approaching middle age, Nvidia’s buyback announcement may be signaling that the company is entering a new phase in the life cycle, intentionally or by accident.
The Scoring
The final piece of the earning release story, and the one that gets the most news attention, is the market reaction to the earnings reports. There is evidence in market history that earnings reports affect stock prices, with the direction of the effect depending on how actual earnings measure up to expectations. While there have been dozens of academic papers that focus on market reactions to earnings reports, their findings can be captured in a composite graph that classifies earnings reports into deciles, based upon the earnings surprise, defined as the difference between actual and predicted earnings:
As you can see, positive surprises cause stock prices to increase, whereas negative surprises lead to price drops, on the announcement date, but there is drift both before and after surprises in the same direction. The former (prices drifting up before positive and down before negative surprises) is consistent with the notion that information about earnings surprises leaks to markets in the days before the report, but the latter (prices continuing to drift up after positive or down after negative surprises) indicates a slow-learning market that can perhaps be exploited to earn excess returns. Breaking down the findings on earnings reports, there seems to be evidence that the that the earnings surprise effect has moderated over time, perhaps because there are more pathways for information to get to markets.
Nvidia is not only one of the most widely followed and talked about stocks in the market, but one that has learned to play the expectations game well, insofar as it seems to find a way to beat them consistently, as can be seen in the following table, which looks at their earnings surprises over the last 5 years:
Nvidia Earnings Surprise (%)
Barring two quarters in 2022, Nvidia has managed to beat expectations on earnings per share every quarter for the last five years. There are two interpretations of these results, and there is truth in both of them. The first is that Nvidia, as with many other technology companies, has enough discretion in both its expenditures (especially in R&D) and in its revenue recognition, that it can use it to beat what analysts expect. The second is that the speed with which the demand for AI chips has grown has surprised everyone in the space (company, analysts, investors) and that the results reflect the undershooting on forecasts.
Focusing specifically on the 2025 second quarter, Nvidia beat analyst expectations, delivering earnings per share of 68 cents (above the 64 cents forecast) and revenues of $30 billion (again higher than the $28.4 billion forecast), but the percentage by which it beat expectations was smaller than in the most recent quarters. That may sound like nitpicking, but the expectations game is an insidious one, where investors move the goal posts constantly, and more so, if you have been successful in the past. On August 28, after the earnings report, Nvidia saw share prices drop by 8% and not only did that loss persist through the next trading day, the stock has continued to lose ground, and was trading at $106 at the start of trading on September 6, 2028.
Earnings Reports: Reading the Tea Leaves
So what do you learn from earnings reports that may cause you to reassess what a stock is worth? The answer will depend upon whether you consider yourself more of a trader or primarily an investor. If that distinction is lost on you, I will start this section by drawing the contrast between the two approaches, and what each approach is looking for in an earnings report.
Value versus Price
At the risk of revisiting a theme that I have used many times before, there are key differences in philosophy and approach between valuing an asset and pricing it.
The value of an asset is determined by its fundamentals – cash flows, growth and risk, and we attempt to estimate that value by bringing in these fundamentals into a construct like discounted cash flow valuation or a DCF. Looking past the modeling and the numbers, though, the value of a business ultimately comes from the story you tell about that business, and how that story plays out in the valuation inputs.
The price of an asset is set by demand and supply, and while fundamentals play a role, five decades of behavioral finance has also taught us that momentum and mood have a much greater effect in pricing, and that the most effective approach to pricing an asset is to find out what others are paying for similar assets. Thus, determining how much to pay for a stock by using a PE ratio derived from looking its peer group is pricing the stock, not valuing it.
The difference between investing and trading stems from this distinction between value and price. Investing is about valuing an asset, buying it at a price less than value and hoping that the gap will close, whereas trading is almost entirely a pricing game, buying at a low price and selling at a higher one, taking advantage of momentum or mood shifts. Given the very different perspectives the two groups bring to markets, it should come as no surprise that what traders look for in an earnings report is very different from what investors see in that same earnings report.
Earnings Reports: The Trading Read
If prices are driven by mood and momentum, it should come as no surprise that what traders are looking for in an earnings report are clues about how whether the prevailing mood and momentum will prevail or shift. It follows that traders tend to focus on the earnings per share surprises, since its centrality to the report makes it more likely to be a momentum-driver. In addition, traders are also swayed more by the theater around how earnings news gets delivered, as evidenced, for instance, by the negative reaction to a recent earnings report from Tesla, where Elon Musk sounded downbeat, during the earnings call. Finally, there is a significant feedback loop, in pricing, where the initial reaction to an earnings report, either online or in the after market, can affect subsequent reaction. As a trader, you may learn more about how an earnings report will play out by watching social media and market reaction to it than by poring over the financial statements.
For Nvidia, the second quarter report contained good news, if good is defined as beating expectations, but the earnings beat was lower than in prior quarters. Coupled with sober guidance and a concern the stock had gone up too much and too fast, as its market cap had increased from less than half a trillion to three trillion over the course of two years, the stage was set for a mood and momentum shift, and the trading since the earnings release indicates that it has happened. Note, though, that this does not mean that something else could not cause the momentum to shift back, but before you, as an Nvidia manager or shareholder, are tempted to complain about the vagaries of momentum, recognize that for much of the last two years, no stock has benefited more from momentum than Nvidia.
The Investing Read
For investors, the takeaways from earnings reports should be very different. If value comes from key value inputs (revenues growth, profitability, reinvestment and risk), and these value inputs themselves come from your company narrative, as an investor, you are looking at the earnings reports to see if there is information in them that would change your core narrative for the company. Thus, an earnings report can have a significant effect on value, if it significantly changes the growth, profitability or risk parts of your company’s story, even though the company’s bottom line (earnings per share) might have come in at expectations. Here are a few examples:
A company reporting revenue growth, small or even negligible for the moment, but coming from a geography or product that has large market potential, can see its value jump as a consequence. In 2012, I reassessed the value of Facebook upwards, a few months after it had gone public and seen its stock price collapse, because its first earnings report, while disappointing in terms of the bottom line, contained indications that the company was starting to succeed in getting its platform working on smart phones, a historical weak spot for the firm.
You can also have a company reporting higher than expected revenue growth accompanied by lower than anticipated profit margins, suggesting a changing business model, and thus a changed story and valuation. Earlier this year, I valued Tesla, and argued that their lower margins, while bad news standing alone, was good news if your story for Tesla was that it would emerge as a mass market automobile company, capable of selling more cars than Volkswagen and Toyota. Since the only pathway to that story is with lower-priced cars, the Tesla strategy of cutting prices was in line with that story, albeit at the expense of profit margins.
A company reporting regulatory or legal actions directed against it, that make its business model more costly or more risky to operate, even though its current numbers (revenues, earnings etc.) are unscathed (so far).
In short, if you are an investor, the most interesting components of the report are not in the proverbial bottom line, i.e., whether earnings per share came in below or above expectations, but in the details. Finally, as investors, you may be interested in how earnings reports change market mood, usually a trading focus, because that mood change can operate as a catalyst that causes the price-value gap to close, enriching you in the process.
The figure below summarizes this section, by first contrasting the value and pricing processes, and then looking at how earnings releases can have different meanings to different market participants.
As in other aspects of the market, it should therefore come as no surprise that the same earnings report can have different consequences for different market participants, and it is also possible that what is good news for one group (traders) may be bad news for another group (investors).
Nvidia: Earnings and Value
My trading skills are limited, and that I am incapable of playing the momentum game with any success. Consequently, I am not qualified to weigh in on the debate on whether the momentum shift on Nvidia is temporary or long term, but I will use the Nvidia second quarter earnings report as an opportunity to revisit my Nvidia story and to deliver a September 2024 valuation for the company. My intrinsic valuation models are parsimonious, built around revenue growth, profit margins and reinvestment, and I used the second quarter earnings report to review my story (and inputs) on each one:
Nvidia: Valuation Inputs (Sept 2024)
With these input changes in place, I revalued Nvidia at the start of September 2024, breaking its revenues, earnings and cash flows down into three businesses: an AI chip business that remains its central growth opportunity, and one in which it has a significant lead on the competition, an auto chip business where it is a small player in a small game, but one where there is potential coming from demand for more powerful chips in cars, and the rest, including its existing business in crypto and gaming, where growth and margins are solid, but unlikely to move dramatically. While traders may be disappointed with Nvidia’s earnings release, and wish it could keep its current pace going, I think it is both unrealistic and dangerous to expect it to do so. In fact, one reason that my story for Nvidia has become more expansive, relative to my assessment in June 2023, is that the speed with which AI architecture is being put in place is allowing the total market to grow at a rate far faster than I had forecast last year. In short, relative to where I was about a year ago, the last four earnings reports from the company indicate that the company can scale up more than I thought it could, has higher and more sustainable margins than I predicted and is perhaps less exposed to the cycles that the chip business has historically been victimized by. With those changes in place, my value per share for Nvidia in is about $87, still about 22% below the stock price of $106 that the stock was trading at on September 5, 2024, a significant difference but one that is far smaller than the divergence that I noted last year.
As always, the normal caveats apply. The first is that I value companies for myself, and while my valuations drive my decisions to buy or sell stocks, they should not determine your choices. That is why my Nvidia valuation spreadsheet is available not just for download, but for modification, to allow you to tell your own story for Nvidia, yielding a different value and decision. The second is that this is a tool for investors, not traders, and if you are playing the trading game, you will have to reframe the analysis and think in terms of mood and momentum. Looking back, I am at peace with the decision made in the summer of 2023 to shed half my Nvidia shares, and hold on to half. While I left money on the table, with the half that I sold, I have been richly compensated for holding on to the other half. I am going to count that as a win and move on!