If one business becomes a victim of a crime, its effects are felt by everyone in the neighborhood. From the victim’s family to the police officer on the scene, crime has a pervasive and damaging effect on our society. This blog offers practical tips to help mitigate business crimes and their effects.
From installing security cameras to managing inventory and conducting employee background checks, these crime prevention tips will help you protect yourself and the neighborhood from harm. Stay safe out there!
Install Security Cameras
Installing security cameras is a great way to keep an eye on your property and protect yourself from potential theft or vandalism.
Consider getting security cameras with remote access, video recording feature, and night vision for increased visibility in dark areas.
Install Access Control System
Businesses of all sizes need to install an access control system to protect their property from theft and vandalism. Make sure to choose the right security system for your business based on the size and type of property. Some common types of security systems used in businesses come with features like CCTV, panic buttons, magnetic locks, and intrusion sensors.
After the system is installed, it’s important to configure it to work correctly. This will involve setting up sensors and alarms to detect when someone enters or leaves the property. It’s also important to set up notifications and alerts to alert employees or post alerts on the company website.
Work with the police
There is no denying the extreme importance of working with the police. By doing so, you can prevent crime and help apprehend criminals.
Make sure to be observant and keep an eye out for suspicious behavior. If you do contact the police, make sure to keep records of what happened and the officers that were involved. This will help you better protect your business and ensure the safety of your employees.
Inventory Management
By properly scanning your current stock and using good inventory management software, you can ensure your goods are accounted for and don’t mysteriously disappear.
Keeping an up-to-date inventory log will also help you make informed decisions about product allocation and sales growth. If you spot an issue, take swift action to address it as soon as possible.
Cybersecurity Protection
Make sure you have up-to-date anti-virus software, practice safe browsing habits, and use a VPN to encrypt your traffic. In addition, keep your passwords confidential and don’t share them with anyone.
Finally, help your employees be cyber-savvy by educating them about phishing scams and how to identify fake emails and attachments.
Get Commercial Insurance
Businesses of all sizes and types need commercial insurance to protect them from a variety of risks. This includes fires, theft, and liability claims.
Make sure you’re using commercial insurance by assessing your business and finding the policy that best suits your needs.
Employee background checks
Maintaining a safe and secure workplace is key, and one of the best ways to do that is by conducting employee background checks.
Background checks can help identify any potential security threats and any illegal activities that an employee may be involved in. This can protect your company from legal liability and help to ensure a safe and healthy workplace for everyone.
Light Up The Perimeter
It goes without saying that security is key for any business. One way to increase security is by installing bright lights around your business place’s perimeter.
This can deter thieves and ensure no one can easily walk in and steal something without getting noticed. Additionally, it can also help you to keep an eye on your business place at all times.
Don’t Let Anyone Be Near Debit/Credit Card Terminals:
Credit and debit card terminals can be tempting targets for thieves. Restricting access to these terminals can help reduce the number of financial crimes and protect your personal information.
You will also stop thieves from stealing your customers’ card information and other confidential data by restricting access.
Parting Words:
Installing high-quality security cameras, bright lights, access control systems, and more can help you protect your business from theft, vandalism, and other forms of crime.
Working with the police and getting the right commercial insurance can also protect your business from potential cyber-attacks. Make sure to read through the blog to learn more about these important topics.
A holding of individual inflation-tracking UK government bonds is the way forward if you want an asset class to hedge UK inflation. But how do you actually buy index-linked gilts?
Thankfully, your neighbourhood investment blogger is here to clear that up.
I’ve personally been pushing this task around my own plate like a seven-year-old told to eat his greens, due to…
Telephone dealing: “I hate you!”
Dirty pricing versus clean pricing faffology: “Stoopid!”
Accrued interest deductions: “Don’t wanna!”
In short, buying individual index-linked gilts meant dealing with the unfamiliar and, as far as I could tell, deeply sucky.
I put the task off for months. Yet now I’ve done it, it doesn’t seem so bad after all.
I suspect I’m not the only one discouraged by mental barriers when looking to buy index-linked gilts.
And so today I’ll walk you through my recent index-linked gilt transaction to demystify the process. I’ll explain any important mechanics as we go, and we can sort any remaining bafflement in the comments.
Missing link(er)
First challenge: not every broker allows you to trade individual gilts.
Of those that do, some enable you to trade at the click of a button, others make you speak to another human at the end of a telephone. (What is this? The Dark Ages?)
Even then your broker may not trade every bond you want, or it may not trade every bond online.
I diversify across two brokers. Of those, only AJ Bell lets me invest in individual gilts.
Thankfully, AJ further enables me to click-to-buy all but two of the UK linkers currently on the secondary market.
No humans required!
If you’re building an index-linked gilt ladder, know that only the 2033 and 2054 rungs are missing from AJ Bell’s roster. (And it might let you buy these by phone too. I’m not sure.)
As it is, I’m building a short-dated rolling linker ladder as modelled in the No Cat Food decumulation portfolio.
How to buy index-linked gilts, step by step
My objective is to keep a portion of my SIPP in a very low-risk, inflation-hedging asset. Three years’ worth of index-linked gilts fits the bill nicely.
Let’s get on with it!
Step one: free up some cash
I flogged off my incumbent global inflation-linked bond ETF (GISG). It’s the best passive short-dated linker fund available in my view, but it still suffered a real terms loss in 2022.
Step two: choose your individual linkers
My rolling linker ladder will consist of three index-linked gilts, ideally maturing in one, two, and three years.
Assuming I don’t need the dosh, then I’ll annually reinvest the cash I get from the latest maturing gilt into a new linker with three years left on the clock.
The snag is there isn’t a linker maturing in 2025. So my first three picks will redeem from 2026 to 2028.
With that decided, the choice is simple as there’s only one linker available per year:
Gilt
Matures
EPIC code
ISIN code
UKGI 0.125 03/26
2026
TR26
GB00BYY5F144
UKGI 1.25 11/27
2027
T27
GB00B128DH60
UKGI 0.125 08/28
2028
T28
GB00BZ1NTB69
No two organisations label their linkers exactly the same way. Search for – and double-check you’ve found – the right security by using its EPIC or ISIN code.
Once surfaced, you can click-through to trade your gilt – assuming your broker is on the grid.
Otherwise, it’s the telephone, or postal order, or semaphore trading for you m’lad / lass.
Brokers who facilitate online gilt trading
Disclosure: Links to platforms may be affiliate links, where we may earn a small commission. It doesn’t affect the price you pay. Your capital is at risk when you invest.
AJ Bell lists its gilt line-up on a specific page.
Hargreaves Lansdown also has a dedicated linker page. Click the Maturity header to place them in a sane running order. But beware, most of HL’s linkers apparently require an expensive telephone trade. See this super-helpful comment from reader Delta Hedge.
iWeb lists linkers too. (This page appears organised by the Muppet Show. Click through on the names to trade.)
Halifax and Lloyds use the same platform as iWeb but in nicer colours.
Interactive Investor trades linkers online but I can’t find a public-facing page. Individual conventional gilts are listed though. You can find index-linked gilts on ii by searching using EPIC codes.
Charles Stanley trades gilts but it looks like a telephone-only service.
Fidelity is an obvious absentee here. Sort it out Fidelity!
Let us know of any other brokers you use in the comments.
Step three: understand how individual linkers are priced
Things can get pretty confusing because of the way index-linked gilts are priced.
Most brokers and online data feeds show each linker’s clean price before you order.
The clean price is typically the nominal price for each gilt.
That isn’t much use because the price you pay is the dirty price.
The dirty price is typically higher than the clean price. That’s because the clean price excludes:
Inflation-adjusted principal and accrued interest for three-month indexation lag linkers.
Accrued interest for eight-month indexation lag linkers.
Bear with!
Inflation-adjusted principal
Inflation-adjusted principal is the bond’s original £100 nominal value modified by the change in the RPI index since it was first issued.
In other words, if RPI inflation has increased by 10% since the linker hit the market, the value of its principal will have increased to £110.
It’s this inflation tracking property that makes linkers so valuable in the first place! (Along with their inflation-adjusted coupon or interest payments)
The clean price does not include inflation uplift on principal for most linkers, whereas the dirty price does.
While we’re here, I’ll just mention that all index-linked gilts are due to switch their link from RPI inflation to CPIH inflation from 2030.
Also while we’re here, bonds are a psychological hellscape of impenetrable jargon. Take the edge off it with our bond terms pain relief.
Also this Debt Management Office (DMO) glossary is a godsend.
Accrued interest
The dirty price includes inflation-adjusted accrued interest. Accrued interest is interest you’ve earned from owning the bond since its last coupon date.
By rights, that accrued interest belongs to the seller who held the bond until you swooped in.
Paying the dirty price (pumped up by the accrued interest) means you compensate the seller for the interest payment they won’t receive – because you now own the bond.
It’s a bit like pass the parcel. The previous owner handed the bond on to you while the music still played. And if you’re still in possession when the music stops, you scoop the whole prize – a semi-annual interest payment no less.
Thankfully, bond traders recognise that a children’s party game is no basis on which to build a thriving capital market. Thus accrued interest keeps everything fair and avoids foot-stamping temper tantrums.
This is also why bond trader parties are no fun.
Your broker will show accrued interest as a cost when you buy a gilt. You’ll make it back next time your linker deposits sweet, sweet income into your account. If you decide to sell a bond early, then someone will pay you any accrued interest in return.
Ownership of the gilt is determined seven business days before each coupon payment date. That seven day stretch is the ex-dividend period – beginning with the ex-dividend date.
If your purchase settles during that period (but not including the ex-dividend date itself) then you don’t pay accrued interest. Instead, you’re entitled to rebate interest. This will show as a Brucie bonus on your contract note.
What’s actually happened is that the seller has already been declared the winner of the next coupon. So if, for example, you take ownership of the gilt on the first day of the ex-dividend period, they owe you for the seven days of interest earned before the coupon paid out.
Just like accrued interest, rebate interest is a ‘fair’s fair’ mechanism. It ensures each party earns the right amount of interest for their period of ownership, regardless of where the coupon apples actually fall.
Fun fact: if your trade settles on the coupon payment date then there is no accrued interest (or rebate interest). Yin and Yang are in balance on this day.
Indexation lag
Eight-month indexation lag linkers upweight principal and coupon using RPI readings from eight months ago. For example, a coupon paid out in December is inflation-adjusted according to the previous April’s RPI index.
Eight-monthers are very much an endangered species. They were issued before 2005 and as mentioned only two remain in circulation: T30I maturing in 2030 and T2IL maturing in 2035.
Three-month indexation laggers represent the latest in UK linker engineering. They only trail inflation by three months.
Under the pricing bonnet, eight-month clean prices include inflation-adjusted principal and three-monthers do not. That’s why eight-monthers look more expensive at first blush.
In reality, it makes no difference. All gilts are bought at the dirty price and if you want a linker that matures in 2030 and 2035 then it’s an eight-monther for you.
Why don’t they show the dirty price?
God knows. It’s not as if they don’t calculate it when you make a purchase. Perhaps someone who knows about the live price plumbing can supply an answer. But it’s an annoying omission.
It’s also the reason why some brokers ask you to state a cash amount when ordering linkers rather than a unit number.
If you’re building a non-rolling linker ladder predicated on buying a certain number of gilts then it’s probably best to over-egg it.
That said, here are three sources of dirty price information:
Tradeweb – Sign up for a free account. Select Index-linked in the Security Type menu and press Submit. Set the Page size to 50 to see every linker on the market.
YieldGimp – Dirty price = Net Price (inc. Accrued) column on the spreadsheet.
LateGenXer – Scroll down and switch on the Index-linked toggle in the left-hand column. Enjoy dirty prices!
Tradeweb is the official supplier of gilt stats to the DMO. However, it only provides the closing dirty price, which it publishes around noon the following day.
YieldGimp updates its dirty prices throughout the day, so this is your go-to source if you want a rough and ready take on how many gilts you can expect to purchase. It won’t be spot-on, as we’ll see shortly. But it’ll be pretty close.
LateGenXer has developed a superb app to help UK investors build linker ladders. The dirty price is updated towards the end of the day. Extend the ‘Number of years’ in the left-hand column to see more linkers.
You can also calculate the dirty price from the clean price on the fly. Updated clean prices are available from the London Stock Exchange. Search using EPIC or ISIN codes.
It requires some spreadsheet kung-fu to beat the dirty price out of the clean price, so we’ll save that for the next thrilling episode of Arthur C. Accumulator’s Mysterious World (of linkers).
Units vs gilts
Okay, one last point on the linker pricing imbroglio.
Gilt prices are typically displayed in pounds not pence. If you see a two or three figure price then that’s the price in pounds per gilt unless it says otherwise.
Tradeweb, YieldGimp, and the London Stock Exchange display prices like this.
The brokers generally do the same. Until they don’t.
Now, just in case you were finding all this too easy, you don’t buy gilts in handy bundles of gilts.
You buy them in units. Each unit is worth a hundredth of gilt.
So if a gilt has a nominal value of £100 then each unit has a nominal value of £1.
Which sounds simple enough but we’re all busy people and it’s easy to forget.
Especially when your broker mixes unit values with gilt prices!
Here are the crazy scenes in my account:
I’ve bought 14,850 units of mystery brand linker A. But my mischievous broker displays the gilt price not the unit price.
14,850 x £148.8817 = £2,210,893
I’m rich! Oh balls, I’m not rich. I just put the decimal place in the wrong column again.
The unit price is £1.488817 because each unit is worth one-hundredth of a gilt. Which explains why the value column is £22,108.93 and I haven’t bought a one-hundred bagger linker.
A single-figure price typically indicates a unit price. A two- to three-figure price suggests gilts, unless some eejit is showing you the price in pence, which some brokers randomly do. Good to keep you on your toes!
If you track your linker winnings on a spreadsheet and something isn’t adding up, then this units/gilt farce will often be the reason. At least it is for me.
Coupons, accrued interest, you name it – the amounts are typically quoted in pounds per gilt, so should be multiplied by your units / 100 when you’re totting them up.
Step four: lose the will to live
Revive with a coffee, a beer, or a fortifying hot chocolate to suit.
Step five: submit your order
I can’t believe it! I’m submitting my order already. So soon?
As I mentioned, nobody knows what the hell price they’re be paying so you’ll be asked to put cash on the table.
Once I did that with my trade, I was treated to this quote screen:
The clean price is just so much screen clutter. Fuggedaboudit.
Although that said, the £1 difference between the clean buy and sell price shows that you may pay a spread of about 10p per unit.
The indicative price is per unit and wasn’t too far out. I’ll explain more about this price in a sec as it’s dirty-ish but not strictly dirty.
The dealing charge was a fiver and very reasonable too. It works out at less than 0.023% of the transaction.
The order type was a market order or a limit order. In the end, I went for a market order.
Notice the small print that says: “Accrued interest payments will also be applied to the estimated total.” The bill for that is coming right up.
Anyway, dear reader, I submitted my order.
Telephone orders
I have not made a telephone order, but Monevator readers Mark Dawse and Sleepingdogs, among others, have reported on the process:
Know which index-linked gilts you want to order in advance.
Identify each one by their EPIC code. It’s much easier than using the longer ISIN number, and will knock precious minutes off the call!
The broker’s agent will repeat back the gilt’s code and other identifying details to ensure you’re both talking about the same thing.
They should quote the fee and an indicative price. You then confirm whether you wish to proceed.
The agent is likely to put you on hold while their team places the trades.
Once all trades have gone through, your agent will list your purchases and the actual prices paid.
Set aside plenty of time for the call, especially if you’re placing several orders in one go.
Step six: “Congratulations on your purchase of UK government debt”
Here are my contract note highlights (never thought I’d find myself saying that):
After the sale, you’ll finally know how many units you’ve bought.
That’s 14,850 – or 148.5 gilts – in this case.
The price per unit is higher than indicated on the quote screen. No biggie.
The consideration number tells me I’ve bought £22,094.15 of linker TR26. (Our mystery brand revealed!)
And I owe 23p in accrued interest. Could be worse.
Notice how accrued interest is a cost on top, like the dealing charge.
Step seven: incur an immediate loss
Every time you buy individual gilts, your broker is likely to show you’ve made an initial loss (unless the price moves sharply in your favour).
Here’s the losses weighing on my three linkers shortly after purchase:
There’s nothing like getting off to a great start, right?
The loss comprises:
A £5 dealing charge
Accrued interest
Unfavourable price moves since purchase
By the time I took this shot, the 2026 linker (TR26) was down 56p price-wise. Meanwhile, the prices of the other two were up £6.59 and £4.54 respectively, reducing my initial losses.
Fam, it’s a rollercoaster.
You may show a much worse loss if your broker values your linkers using the nominal clean price.
If AJ Bell did that then my valuation would have looked approximately like this:
Gilt
Units
Clean price
Value
UKGI 0.125 03/26
14,850
£99.16
£14,725.26
UKGI 1.25 11/27
10,660
£103.40
£11,022.44
UKGI 0.125 08/28
15,932
£99.92
£15,919.25
My holding would have appeared down by nearly £25,000 if it was valued by the clean price. (Remember the clean price is divided by 100 to get the unit price).
If you are seeing massive losses like that then there’s almost certainly no cause for alarm. (Assuming they’re caused by the clean price method which they probably are.)
Your index-linked gilts are actuallyvalued by the dirty price. This includes all that lovely inflation uplift and accrued interest.
I’ll include a spreadsheet in the next part of this series so you can properly track the value of your holdings using the intra-day dirty price.
Inflation-adjusted clean price and this accrued interest business
Although AJ Bell isn’t valuing my linkers by the nominal clean price I don’t think it’s using the dirty price either.
If it was, then my portfolio wouldn’t show a loss due to accrued interest – because accrued interest is included in the dirty price.
So it must be valuing my units by the inflation-adjusted clean price. That is:
The dirty price minus accrued interest. Or, in other words, the clean price incorporating inflation-adjusted principal.
Thus my linkers should be worth a little bit more than shown in the last screenshot above. Because if I sold them immediately after purchase, I’d be due the accrued interest I’d bought, but never received, because I sold out before the next coupon payment.
It’s all relatively easy to calculate but let’s leave it for the spreadsheet episode to come. Tradeweb also publishes accrued interest figures per gilt (see the link waaaaay above.)
Step eight: stop writing about index-linked gilts
Don’t mind if I do.
Hope this all helps someone.
Take it steady,
The Accumulator
Thanks for reading! Monevator is a spiffing blog about making, saving, and investing money. Please do sign-up to get our latest posts by email for free. Find us on Twitter and Facebook. Or peruse a few of our best articles.
We spent a lot of time with my grandparents when I was a kid. My mom, brother, and I lived a few hours away from the rest of the extended family, but we would visit at least once a month and for much of the summer each year. My brother and I had our own bedrooms at their house and spent countless hours with them. Because we stayed with them when we visited, we didn’t just see the fun, “let’s do a craft!” grandparent side of their personalities—we also got to participate in their daily lives. We’d help with chores and projects, and we’d get dragged along to meetings and appointments.
My grandparents were married for more than 60 years, and they raised six children together. They lived long, full lives. They weren’t well off, but they worked incredibly hard and managed their money well. My grandpa, or Papa as we called him, was a first-generation Italian-American, born just before the Great Depression. My grandma was about a decade younger and was one of five siblings. He was a Navy veteran, though he was fortunate never to see combat; after the war, he graduated from an engineering school and got a job with General Motors. He worked for GM for 30 years and eventually retired with a full pension. My grandma raised six children and worked retail jobs—bank teller, sales associate, etc.—as their kids got a little older.
Raising six kids on an engineer’s salary sounds tough. Somehow, they built and owned their home, several of their kids attended parochial school, and they took annual family vacations. And, impressively, they also managed to save sufficiently for their retirement.
I was lucky enough to learn a few lessons from them as I was growing up. My husband, an early-career PM&R doc, and I keep these ideas in mind as we manage our family’s finances.
Learn from Others and Each Other
My grandma, Noreen, ran a women’s investment club in the 1980s and 1990s—Women Making Money Incorporated. Club members would gather at my grandparents’ house each month to learn about making investment decisions and managing their own investment portfolios. The women pooled some of their own money to develop an investment fund for the club. They developed a strategy together, selecting individual stocks to invest with the club’s funds. No one in my family has the records from these meetings anymore, but we know that they picked a few long-term winners, including Apple. As the group built the club’s investment portfolio, the women also gained knowledge and experience that helped them better manage their own personal holdings.
My Papa served as an advisor and mentor to my grandma in managing the club. According to my aunt, my grandma would always run upstairs to “ask Louie something,” but he never came down—leading many members to wonder if there really was a Louie!
We don’t run an investment club like my grandparents, but my husband does manage a financial lecture series for his residents and I share our financial experiences here. We try to have monthly meetings to review our short-term finances and sit down twice a year for a more in-depth review of our overall portfolio. Because we each manage a different area of our financial lives (I oversee our short-term expenses and budget, while my husband oversees our long-term plan), we have to teach each other a bit during these conversations.
Talking about money can be an emotionally loaded topic to begin with—adding the concept of teaching your spouse about a specific aspect of financial management only adds to the fun. There’s a fine line to walk before it gets too tense! So, just like the members of Women Making Money Incorporated, we also rely on others to expand our knowledge–like The White Coat Investor and friends in similar financial situations.
More information here:
How Creating a Budget Helped Us Decide If We Could Afford $1,000 Plane Tickets
Dividing Responsibilities in Our Marriage to Accelerate Our Financial Independence
Know What You’ve Got
Louie kept meticulous financial records. (Meticulous records of everything, to be honest!) He kept his bank statements and investment summaries for decades and often annotated them with his questions and thoughts. He organized these documents in a filing system that enabled him to find any single record quickly. At any given moment, he knew exactly how much money he had and in what accounts it was held.
Noreen, who worked as a bank cashier for years, often helped my mom balance her checkbook. I remember my mom would bring a bag filled with check duplicates, checkbook registers, and receipts when we would visit. They’d sit at the dining room table for a few hours and balance everything. My grandma’s final word: it’s OK if it doesn’t balance out, as long as the bank’s total is higher than yours!
In my life, I’ve witnessed the transition from mailed statements to digital records. With the online records and e-statements, I’ve found it tempting to rely on the records housed on my bank and credit card websites. I certainly don’t keep individually annotated receipts for all my purchases like my Louie did. I do keep digital copies of receipts for big purchases or for those I might eventually need to submit a warranty claim on—things like appliances and electronics. I also review and categorize all of our expenses each month, applying my Grandma Noreen’s advice of allowing the bank to be right when things don’t balance out based on my records. All of the receipts from the more day-to-day Target trips, though? Straight in the trash. (Shh! Don’t tell Papa!)
Be Thoughtful About What You Outsource
Papa had a great deal of financial expertise, but it brought him comfort and security to outsource the daily management of his portfolios to a financial advisor at his credit union. He was a nervous guy and probably would have panicked a bit in a bad market. He needed someone else to see him through the stressful times.
Shortly after I started my first teaching job, he set me up to meet with “his financial guy.” We looked over my student loan balance, discussed a payoff plan, and reviewed my retirement savings strategy. He encouraged me to prioritize my retirement savings over paying off my student loans. The timeline and numbers we discussed were very different than the plan I’m working with now, but my income and debt as an unmarried teacher were also very different than they are now.
My mom still uses that same financial advisor, and we’ve run the numbers on his fees and reviewed the growth he generates—he seems to be one of the good guys. His strategy of prioritizing retirement savings over almost everything else is one that my husband and I still follow.
Louie appreciated his financial advisor’s expertise; that was pretty much the only service he outsourced. They lived on a good-sized chunk of land, and he spent a few hours on the lawn mower once a week well into his 80s. Most home projects were of the DIY variety, with his kids bringing additional assistance and experience.
My husband and I appreciate my grandparent’s wisdom here, but we’ve gone the opposite route as far as financial management. We educated ourselves enough to oversee our finances and investment portfolio rather than outsourcing this. Having thought a lot about the value of our time and our goals for our money, though, we are willing to outsource some household tasks to save a bit of time and energy. Right now, we’re exploring the idea of having someone help with some housekeeping chores—the cleaning, laundry, and meals—so that we’re not spending our precious free time scrambling to get things done.
More information here:
What’s the Value of Our Time, Anyway?
Spend When It Counts
Lou and Noreen were undoubtedly thrifty, but still, they spent money on what mattered. They took a few trips to the tiny Italian mountain town where my Papa was from and spent money on their kids and grandchildren. These are our values as well—we want to use our money to enjoy our lives while making memories with our kids, extended family, and friends. And, like my grandparents, when we spend money, we’re willing to pay a little more for a quality experience or service.
Even my husband, who only knew my Papa for a few years as his health was failing, recalls his insistence on doing things once and doing them right. He took great pride in his work, and while he was frugal, he’d spend money if necessary. He just wanted to be sure he was spending it in a way that counted.
We recently had one of my grandfather’s old watches cleaned and restored as a holiday gift for my mom. As the family budgeter, I told my husband what we could spend. When he called me after dropping off the watch for repair, he opened with a story:
“Well, I know Papa meant a lot to you guys. He was a good dad and grandfather, and he took a lot of pride in his work and his things. He took care of his stuff. So, if we’re gonna do this, if we’re gonna get this watch repaired, I just really think we have to do it right. It’s going to cost a little more than you planned on, but I think we have to do it right to honor him, you know?”
How am I supposed to argue with that? We got the watch serviced, and it turned out beautifully. As our financial flexibility increases, we try to model some of my grandparents’ values in our spending and, ultimately, to remember that money is a tool to help us enjoy our lives.
More information here:
Financial Flexibility – Don’t Spend It All at Once
A Life Well Lived
My husband and I prioritize financial stability and joy, having a solid plan for emergencies, and then spending money on our family and making memories with our kids. We’re almost four years post-fellowship and still live in the 1,100-square-foot home we bought during my husband’s residency. We’re absolutely ready to move somewhere with more space, but we’re willing to wait on that until we can get my husband’s student loans paid off. (This is the year!)
Between my Papa scheduling us joint appointments with his financial advisor and watching my grandma diligently balance my mom’s checkbook, I learned a great deal about money management from my grandparents. These explicit and observed lessons continue to impact my approach to finances today.
What did you learn from your family members about finance? Does that knowledge impact how you live and spend today? Comment below!
State Bank of India (SBI) ke Regional Business Office (RBO) PEN ne ek naya directive jari kiya hai jisme officers ko chhutti lene se pehle authority se prior approval lena zaroori hoga. Iss order ka maksad ye hai ki leave requests ko formal tareeke se manage kiya ja sake, taaki branch ke kaam me koi disruption na ho.
Pen, jo Maharashtra ke Raigad district mein ek town aur taluka hai, yeh order wahan ke SBI officers par lagu kiya gaya hai. Iss se bank ki efficiency aur smooth functioning ko behtar banaya ja sakega, aur ensure kiya ja sakega ki management ke sath leave coordination ho, taaki staff shortage se bacha ja sake.
Pros
Improved Workflow Planning: Isse staffing ka behtar management ho sakega aur operations smoothly chalenge.
Enhanced Accountability: Officers ko apni leaves advance mein plan karni hogi, taaki unplanned absences ka risk kam ho.
Better Coordination: Officers aur management ke beech achha coordination rahega, aur critical roles cover kiye ja sakenge.
Prevents Staffing Shortages: Multiple officers ek hi time par leave nahi le payenge, jo staff shortage se bacha sakta hai.
Transparency in Leave Management: Formal process se leave management mein transparency aur fairness bani rahegi.
Cons
Reduced Flexibility: Emergency situations mein officers ke liye leave lena mushkil ho sakta hai.
Increased Bureaucracy: Approval process se paperwork aur administrative steps badh sakte hain.
Potential for Delays: Agar leave approve karne wali authority delay kare, toh officers ko chhutti lene mein problem ho sakti hai.
Employee Morale Impact: Kuch officers ko lag sakta hai ki yeh unke personal time par zyada control hai, jo morale par asar daal sakta hai.
Limited Spontaneity: Impromptu breaks lena mushkil ho sakta hai, jo work-life balance ko effect kar sakta hai.
A long-range plan (LRP) bridges the current year’s tactics to longer-term business objectives. It confirms and supports investor expectations. The goal is to progress the company along two critical dimensions:
Revenue Durability: Prove customers can be acquired at a predictable cost, retained, and expanded over their lifecycle.
Free Cash Flow Sustainability: The company reaches a point where it no longer relies on external capital, and has thought through where profits will go (i.e., reinvest for growth, distribute to shareholders, etc.)
Long-range planning is an exercise in resource allocation across several years. It marches the company towards what “good” looks like at “scale”, however you define both of those characteristics in the context of the industry you play in.
While annual planning is more granular and focused on specific targets for the next 12 months, long-range planning is about setting directional goals for the business that arrive at a target financial profile over time. It’s more strategic, requiring a marriage of top-down industry forecasts with bottom-up operational realities.
Long-range planning also forces companies to consider the full product lifecycle, from roadmap development to monetization. It’s not just about optimizing current products but also forecasting when new products will hit the market, estimating both their costs and revenues.
While in an annual operating plan you forecast at the general ledger (GL) level and by vendor names (e.g.,. Salesforce, Gong, NetSuite), you can theoretically build a solid LRP by concentrating on go to market resources, GTM output, and grossing up the remaining non payroll items using a set of basic assumptions.
Why is that possible?
70% to 80% of software company expenses are people related. 10% to 20% are hosting and infrastructure. And the remaining bits and pieces are nonpayroll, like rent and travel. Most of the juice is in the people bucket, and much of the rest can be rolled forward within a relatively high degree of accuracy, especially if the underlying assumptions are linked to said headcount growth.
The type of LRP you build will be based on:
The current state of financial maturity at your company
The specific questions you are trying to answer at that point in time
How much time you are willing to spend on it
To drill into the last point – you can always go deeper and take longer to turn the screws; but the real question is what you’ll be using this model for. That should dictate the LRP’s dimensionality (HardMode by Thomas Robb).
It’s common to have one core LRP the org relies on for board purposes, and to “version up” on an ad hoc basis when you need to stress test what doing [xyz] would look like. Remember – we’re designing a tool for longer term decision making; not a statue for the Louvre.
The biggest thing I try to focus on, since revenue growth is the most important, is giving as much detail as possible to the go to market (GTM) side of the house. If there is an area I want to spend more time on, I push to add more information on sales capacity:
GTM resources not only dictate the company’s revenue capacity for future years, they also make up more than 50% of headcount costs. So getting your GTM modeling right, including productivity and cost, determines your LRPs strategic value.
Building a strong LRP starts with defining your key assumptions. Typical assumptions might be:
We will launch one new product per year.
We’ll rely on areas outside the US to make up 25% or more of our revenue at some point
We’d like to capture 10% of our total addressable market (TAM)
We strive to achieve positive cash flows within the next 24 months
We must maintain a revenue growth endurance score of 70% or more
We will ensure our ARR per head is top quartile, based on benchmarks
The FP&A or Strategic Finance team should maintain an “assumptions log,” revisiting and revising it over time to ensure the objectives and assumptions evolve with the business.
As we mentioned, this is where the rubber hits the road. Ensure you plan for the following:
Get the hottest Fintech Singapore News once a month in your Inbox
The Singapore government has blocked NTUC Enterprise’s proposed sale of Income Insurance shares to Allianz, citing concerns over the structure of the deal.
The decision comes despite no objections to Allianz’s suitability as a partner.
The government has tabled an amendment to the Insurance Act in Parliament, enabling the Monetary Authority of Singapore (MAS) to withhold approval of transactions involving current or former cooperative insurers if public interest is at stake.
Minister Edwin Tong
Minister Edwin Tong explained in a ministerial statement that the government supports a strong partner for Income to strengthen its capital base, but concerns arose from the transaction’s structure, especially in light of assurances made during Income’s corporatisation in 2022.
The government highlighted the lack of clarity on how the deal would affect Income’s social mission, a core principle it committed to uphold during its transition from a cooperative to a corporate entity.
Income Insurance was corporatised in 2022, transitioning from NTUC Income Co-operative Ltd to a company structure.
The move aimed to enable the insurer to better compete in a tightening regulatory environment and attract strategic partners.
During this process, Income carried over S$2 billion in surplus, which was granted an exemption by the Ministry of Culture, Community and Youth (MCCY) to support its business continuity.
However, the government now questions how this surplus would be used under the Allianz deal, as there is no clear plan to ensure the funds would continue to support Income’s social mission.
The proposed sale involved Allianz acquiring a 51% stake in Income for S$2.2 billion, with a plan to streamline operations and optimise capital, including a projected S$1.85 billion capital return to shareholders within three years of the transaction.
This potential capital extraction raised concerns, as it contradicts Income’s earlier representations to MCCY that the corporatisation aimed to build capital strength.
In response to these concerns, the government has decided to intervene, believing that the deal, in its current form, may undermine the social mission of both Income and the cooperative movement in Singapore.
Although the financial prudential requirements have been met, the government’s focus extended beyond regulatory capital adequacy to include the broader impact on Income’s role as a social enterprise.
Income Insurance has acknowledged the government’s decision and committed to take into consideration the proposed amendments to the Insurance Act.
The company affirmed it would work closely with relevant stakeholders to consider the next steps.
NTUC Enterprise echoed this statement saying,
“NTUC Enterprise has consistently acted in good faith to safeguard the interests of shareholders, policyholders and employees of Income Insurance. It believes that Allianz’s offer will enable Income Insurance to be even more relevant and resilient over the long term, to fulfil its social commitments, and meet its obligations to its policyholders.
NTUC Enterprise will study carefully the implications of the Ministerial Statement by Minister Edwin Tong and the amendments to the Insurance Act, and work closely with relevant stakeholders to decide on the next course of action.”
Allianz, one of the world’s largest insurance companies, expressed respect for the government’s position and indicated it will collaborate with Income and NTUC Enterprise to consider revisions to the transaction structure.
“We are convinced that partnering with Income Insurance, a company that shares Allianz’s values and commitment to customer excellence, will benefit Singapore’s customers and society,”
the insurer said in a statement.
The amendment to the Insurance Act, which was tabled on 14 October 2024, is set to be debated further in Parliament on 16 October 2024.
The changes will allow MAS to consider broader public interest issues when assessing transactions involving cooperative-linked insurers, ensuring that future deals align with both financial prudence and social objectives.
Balancing Increased FTE Expense with Improved Process Efficiencies
Across various parts of the country, community banks and credit unions are experiencing massive overall growth. This has led to faster growth in return on asset ratios, higher net interest margins, and higher loan growth rates. Even with looming economic hurdles on the horizon and talks of an impending recession, executives at these community financial institutions are trying to strike the balance between managing the growth, maintaining operational efficiency, maximizing talent management, and navigating new employee hiring cycles. At an elevated level, let’s focus on this continuous attempt for community lenders to find the balance on these multiple fronts.
When someone hears I’m currently writing the authorized biography of William (Bill) Sharpe, the most frequent question I get is, “Is he still alive?” Sharpe is the 1990 recipient of the Sveriges Riksbank Prize in Economic Sciences in Memory of Alfred Nobel, commonly known as the Nobel Prize in Economics. And, yes, in September 2024, he is still alive and well. He lives in Carmel-by-the-Sea in California. Every Thursday morning, he meets with his coffee klatch. He can often be seen walking his bichon-poodle near Carmel Bay. In June 2024, he celebrated his 90th birthday.
And September 2024 was another Sharpe milestone: the 60th anniversary of his seminal capital asset pricing model (CAPM) paper in The Journal of Finance. It is extremely rare for research to remain relevant after a decade let alone six. I’ll explain what the paper is about, how it impacted the investment industry, most likely including your own portfolio, and why it still matters.
Photo by Stephen R. Foerster
The C-A-P-M
Let’s talk about the model’s name, common acronym, and what it’s really about. First, Sharpe never called it the “capital asset pricing model.” As the title of his seminal article indicates, it’s about “capital asset prices.” Later researchers referred to it as a model, adding the M. Second, once it became known as the capital asset pricing model, it was referred to by the acronym CAPM, pronounced “cap-em.”
Virtually every finance professor and student refer to it as “cap-em” — everyone except Sharpe himself. He always uses the initialism C-A-P-M. (So, if you want to honor the creator of the model, you can refer to it as the C-A-P-M!) Third, the focus isn’t really about prices of assets, but rather their expected returns. One of the key insights of the CAPM is that it answers an important investment question: “What is the expected return if I purchase security XYZ?”
Key Assumptions
Sharpe had written a paper published in 1963, “A Simplified Model for Portfolio Analysis,” that presented some of the same key concepts as in the seminal 1964 paper. There is an important difference between the two papers. As Sharpe later described it, in the 1963 paper, he carefully “put the rabbit in the hat” before pulling it out. The 1963 paper also answered that key question, “What is the expected return if I purchase security XYZ?”
But the rabbit he put in the hat was a preordained relationship between a security and the overall market — what I’ll describe later as beta. Andrew Lo and I interviewed Sharpe for our book, In Pursuit of the Perfect Portfolio:The Stories, Voices, and Key Insights of the Pioneers Who Shaped the Way We Invest. “So, I spent several months trying to figure out how to do it without putting the rabbit in the hat,” he said. “Was there a way to pull the rabbit out of the hat without putting it in to begin with? I figured out yes, there was.” In the 1964 article, Sharpe didn’t put a rabbit in the hat but rather he derived a market equilibrium based on theory.
With any theory, you need to make assumptions, to simplify what happens in the real world, so that you can get traction with the theoretical model. That’s what Sharpe did. He assumed that all that investors care about are expected returns and risk. He assumed investors were rational and well-diversified. And he assumed investors could borrow and lend and the same rate.
When Sharpe initially submitted the paper for publication in The Journal of Finance, it was rejected, mainly because of Sharpe’s assumptions. The anonymous referee concluded that the assumptions Sharpe had made were so “preposterous” that all subsequent conclusions were “uninteresting.” Undeterred, two years later Sharpe made some paper tweaks, found a new editor, and the paper was published. The rest, as they say, is history.
The CAPM in Pictures
Much of Sharpe’s classic paper focuses on nine figures or graphs. The first seven are in two-dimensional space, with risk — as measured by the standard deviation of expected returns — on the vertical axis and expected return on the horizontal axis. (Any finance student will quickly note that the now-common practice is to flip axes, which is represent risk on the horizontal axis and expected return on the vertical axis.)
On his horizontal axis, Sharpe began with the return on a special security that he called the “pure interest rate” or P. Today, we would refer to that special rate as the Treasury Bill return, or the risk-free rate, commonly represented as Rf.
The curve igg’ is Harry Markowitz’s efficient frontier: the “optimal” combination of risky securities such that each portfolio on the curve has the highest expected return for a given level of risk, and also the lowest risk for a given level of expected return. Sharpe’s model essentially looked for combinations of the risk-free security, P, with each portfolio on the curve igg’ that would provide the optimal risk-expected return. It is clear from the graph that the optimal mix is formed by a line from P that is tangent to curve igg’ — in other words, the mix that combines the risk-free asset P and portfolio g.
In Sharpe’s world, we can think of the investor as essentially having three choices. She can invest all of her money in risky portfolio g. If that’s too much risk for her, she can divide her portfolio between combinations of risk-free P and risky g. Or, if she wants even more risk she can borrow at the risk-free rate and invest more than 100% of her wealth in risky g, essentially moving along the line toward Z. The line PgZ is Sharpe’s famous Capital Market Line, showing the optimal combination of risk-free and risky investments, including either lending (buying a Treasury Bill) or borrowing (at the Treasury Bill rate).
The Footnote that Won a Nobel Prize
After presenting a series of graphs, Sharpe showed how this could lead to “a relatively simple formula which relates the expected rate of return to various elements of risk for all assets which are included in combination g. He then refers the reader to his footnote 22, an extensive 17 lines of equations and text that may be one of the most consequential footnotes in all of finance and economics literature.
That last line of the footnote may not look familiar, but with a bit of sleight-of-hand it will come into focus. Sharpe gave the left-hand-side a new name: Big, with “ig” as the subscript. In technical terms, Big is the covariance of the return on security i relative to security g, divided by the standard deviation of g. When creating the manuscript, Sharpe used a typewriter, with standard keys. What he really meant by B was the Greek letter b or beta. And as we’ll see, that has become one of the most used measures of risk today.
What Drives Expected Returns?
One of the key insights from Sharpe’s model is that when it comes to a security’s expected return, all that matters is Big, or beta.
In Sharpe’s final graph, expected return is still on the horizontal axis, but his new measure of risk, Big or beta, is on the vertical axis. Now the line PQ is actual the CAPM equation. What it powerfully shows is that, assuming an investor holds a well-diversified portfolio, the only measure of risk that matters is beta, or how risky the security is relative to the overall portfolio g. Since all investors want to hold g, then it must contain all assets. In other words, it must be the market portfolio. Today, we call that portfolio M.
We can now re-write Sharpe’s original derivation of the CAPM to the more-familiar version: E(Ri) = Rf + b x [E(Rm) – Rf] or E(Ri) = Rf + bi x MRP, where i represents security i and MRP is the market risk premium. Here’s the intuition. Let’s suppose you’re considering investing in a stock for the next 10 years — or maybe not. Alternatively, you could invest in long-term Treasuries and secure a return of Rf. Or you could invest in the market as a whole and get an expected return of E(Rm). That works out to be the same as Rf + MRP. Or finally, you could invest in security i. Your expected return, E(Ri) would be driven by how much market risk you are exposed to, bi.
Beta has a simple interpretation: how risky a particular security is relative to the overall market. In terms of benchmarks, by definition “the market” has a beta of 1.0. For a particular security, beta suggests what the particular return change is for every 1.0% change in the market. For example, for a low-risk stock with a beta of 0.5, if the market (often proxied as the S&P 500 Index) goes up by 1.0 percent, we would expect stock i to go up by 0.5 percent; if the market is down by 1.0%, we expect stock i to go down by 0.5 percent. The same logic holds for a risky stock, say with a beta of 1.5. If the market goes up by 1.0%, we would expect stock i to go up by 1.5%. If the market is down by 1.0 percent, we expect stock i to go down by 1.5%.
Why the CAPM Still Matters
Sharpe’s seminal 1964 paper matters for three reasons.
Beta is the appropriate measure of risk for a stock that is part of a diversified portfolio. It is also a widely available measure, on sites such as Yahoo!Finance. All that matters is risk relative to the market. If you have a diversified portfolio, it doesn’t matter how volatile a stock is on its own.
Sharpe’s model, and in some sense Figure 7, shows us a way to measure performance across well-diversified portfolios such as mutual funds. We can measure a fund’s performance or return, say over the past five years, in excess of what a risk-free investment would have returned. That’s the return measure. If we compare that to the fund’s risk, as measured by the standard deviation of the fund’s return over that period, we have a return-to-risk measure. That’s what Sharpe described in subsequent research papers and became known as the Sharpe ratio. It’s probably the most common measure of performance today.
In Sharpe’s CAPM paper, he defined his special portfolio, g, the one that everyone would want to hold, as one that represented “all assets.” That’s why we call it the market portfolio. In a narrower interpretation, it should at least contain all stocks. Specific to the United States, that implies buying an index fund like one that replicates the S&P 500 Index. We have Sharpe’s model to thank for the multi-trillion-dollar index fund that has emerged over the past 50 years. Chances are that you’re invested in an index fund, either directly or indirectly, say through a pension fund.
Of course, the CAPM has its critics. There are some competing models of expected return that capture additional factors beyond the market. There are some questionable empirical test results. And yet, the model is still front and center in finance courses and still used by practitioners. And it’s a very intuitive model. It has stood the test of time.
So please join me in wishing the CAPM a happy birthday, with many more to come!
I’ve heard Ben mention several times recently that we are in year 15 of a bull market. He’s obviously referencing the end of the GFC in 2009 as the start of the current market cycle. Have we not had two bear markets in 2020 and 2022 (defined as -20% from the high)? When you had Tom Lee on last year (TCAF) he said 2024 was going to be year 2 of a bull, so he’s got a different definition. Can you please explain what people in the finance community use to define ends/beginnings of cyclical markets?
Here’s the chart in question from a recent blog post:
Did the bull market from 2009 get reset in 2020 or 2022? Or should we keep it going just like we did with the 1987 crash during that bull market?
The problem is these things aren’t exactly scientific.
There are some loosely accepted definitions but you have secular bull and bear markets as well as cyclical bull and bear markets. Things can get murky since different investors have different rules when it comes to hitting the reset button and starting over.
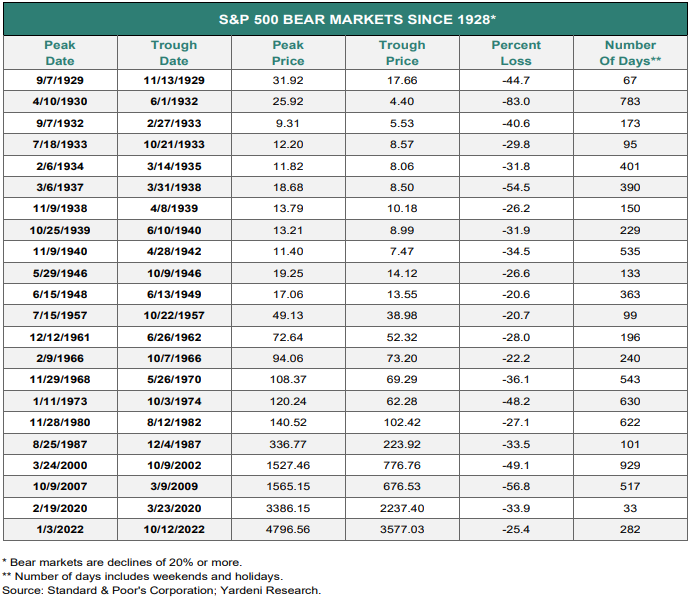
One standard definition is a loss of 20% or more means the start of a bear market and end of a bull market, at least on a cyclical basis.
Yardeni Research publishes some handy historical bull and bear market tables1 going back to the 1920s. Here’s the bull market table:
And the bear markets:
You can see there are plenty of both bull and bear markets.
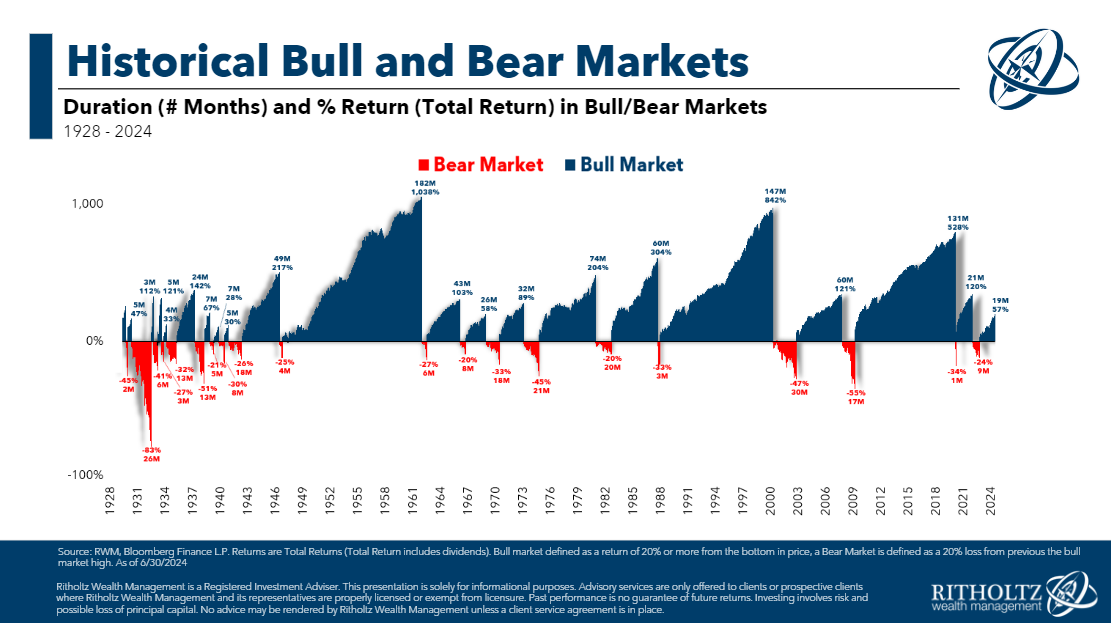
Here’s a chart we created that allows you to visualize these cycles:
It is important to recognize that using this 20% definition puts many of these bull and bear markets in the cyclical stage.
The problem is many of them were just countertrend rallies or downturns within the context of a broader long-term uptrend or downtrend.
For example, there was a cyclical bull market from the end of 1929 through early 1930 when stocks rose ~50%. The Great Depression crash didn’t technically bottom until 1932. No one looks back at that dead cat bounce as a bull market. It was a minor reprieve during a massive downturn.
The 1987 crash was the opposite. No one really thinks the 1980s bull market ended in 1987. That was a countertrend crash but the bull market charged higher for many years after that.
The Covid crash was our 1987 moment. And the 2022 bear market was run-of-the-mill not some giant financial crisis that altered the secular uptrend.
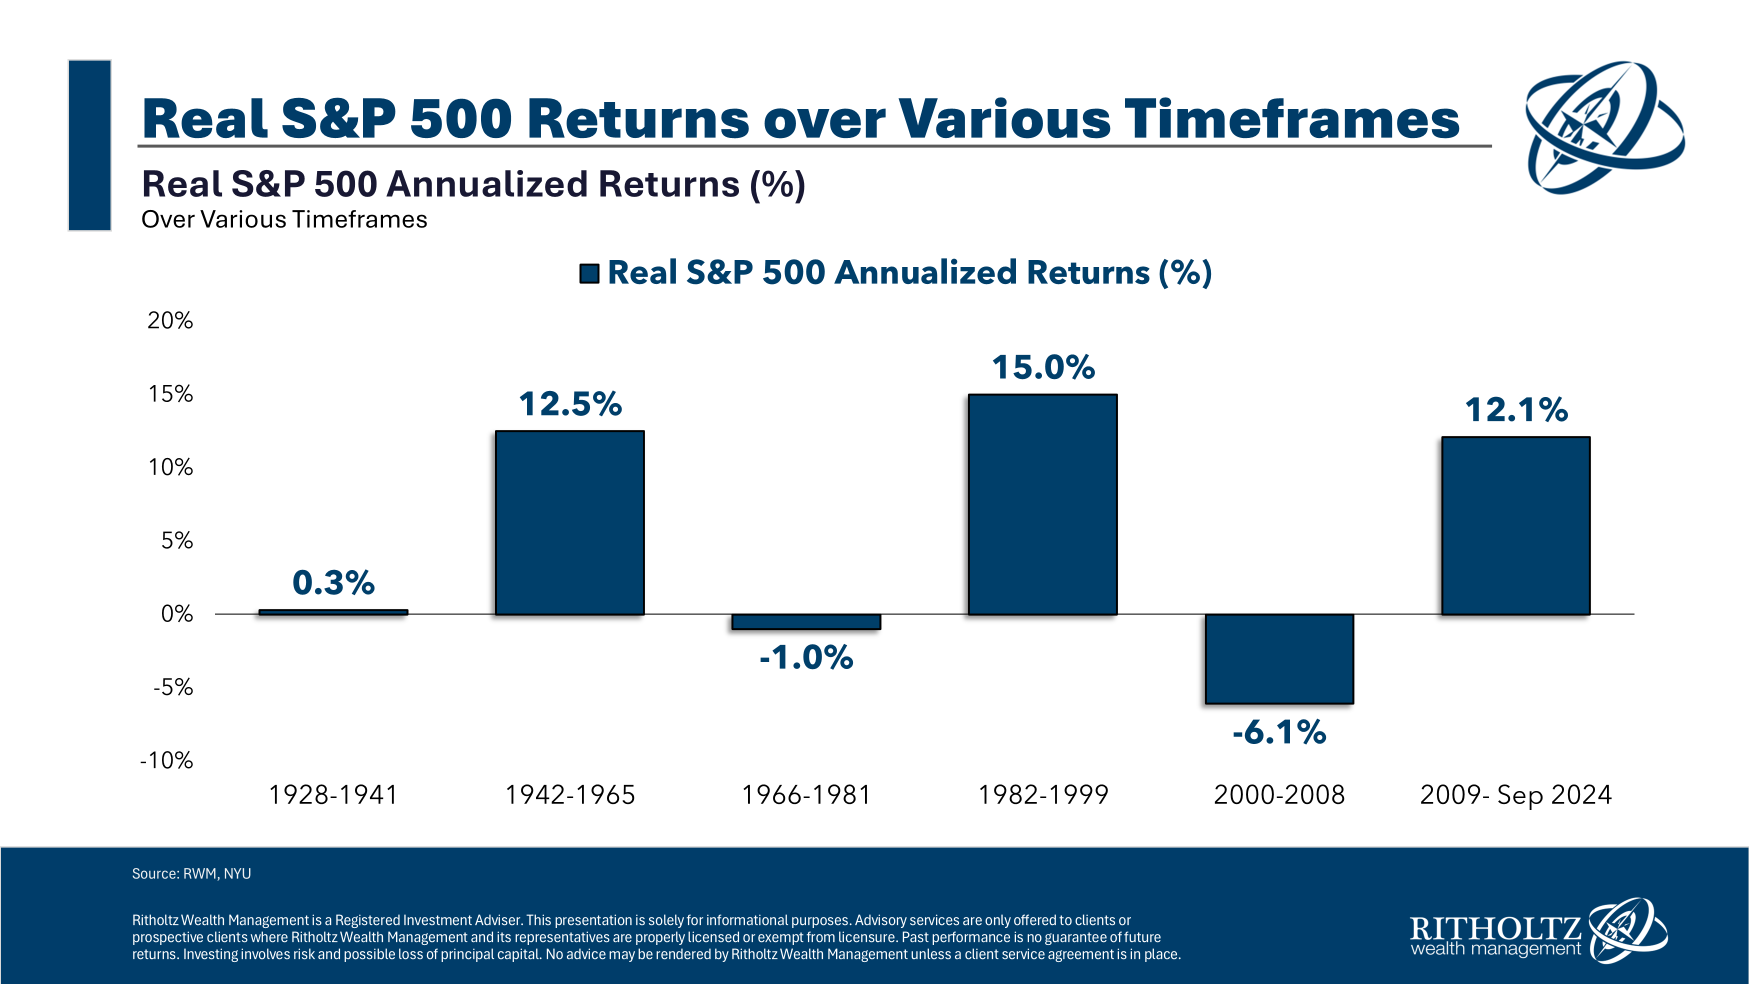
Take a look at my version of secular bull and bear markets:
So while there are 20+ cyclical bull and bear markets over the past 100 years or so, there have really only been six secular longer-term periods.
The extended secular bull market from 1942-1965 is a good example of why you can’t call an end to a long-term bull market just because stocks were in a technical bear market. In this time frame, the S&P 500 was up almost 13% after accounting for inflation, but there were setbacks along the way.
I count four bear markets:
1946 -26.6%
1948-1949 -20.6%
1957 -20.7%
1961-1962 -28.0%
There is a difference between a bear market and a crash.
There have also been a handful of 19% and change corrections over time. I count four since the mid-1970s — in 1976-1978 (-19.4%), 1990 (-19.9%), 2011 (-19.4%) and 2018 (-19.8%). If we’re being generous we could round those up. It’s not like a 20% loss feels any worse than a 19% loss.
The one big difference between the current run and previous versions is that this secular bull market started at the very bottom of an earth-shattering bear market, which wasn’t the case in previous bull runs.
The stock market bottomed in 1932 but the bull market didn’t start until 1942.
The stock market bottomed in 1974 but the bull market didn’t start until 1982.
This time around the stock market bottomed in 2009 and the bull market started immediately. There was no sideways move following the Great Financial Crisis, just a giant V-shaped recovery.
What changed?
Basically, we now get bazookas fired by the government and the Fed. Monetary and fiscal policy are used during financial crises on a scale we’ve never seen before. During the Great Depression, the Fed and government worsened the situation by tightening spending and Fed policy.
We’ve learned our lessons from the past.
I’m not saying we can’t have extended bear markets anymore. We can and will.
But the addition of fiscal and monetary stimulus during the worst downturns means the snapbacks will likely come quicker than they did in the past (assuming that stimulus doesn’t go away).
Is this entire conversation a bit of semantics?
Yes.
But so are most historical stock market conversations because markets don’t operate like physics. Most of the time we can’t define these things until after the fact.
And that’s what makes them interesting to argue about.
There are no scientific relationships in the markets so we have to make stuff up as we go.
We discussed this question on the latest edition of Ask the Compound:
Nick Maggiulli joined me on the show this week to tackle questions about investing in total stock market index funds, how to value your pension, factors that allow you to take more risk in your portfolio and when to sell your big winners.
Further Reading: An Epic Bull Market
1It’s worth noting these are price returns only, no dividends included.
Boeing’s announcement on Tuesday that it plans to shore up its finances with up to $35bn in new funding is the latest response to a crisis that has engulfed the US plane maker over the past five years.
Fatal crashes of its 737 Max aircraft in 2018 and 2019, followed by the Covid-19 pandemic and January’s mid-flight blowout of a door panel on one of its planes, had already severely stretched the company’s finances.
Boeing, which last reported a profit in 2018 and has consolidated debt close to $58bn, is burning through an estimated $1bn a month as a strike by its largest labour union has halted production at its main factories in Washington state since last month.
With the strike showing little sign of ending any time soon, the pressing question is whether the company has done enough to preserve its investment credit rating.
Has Boeing done enough to please bondholders?
Bondholders the Financial Times spoke to broadly welcomed Boeing’s plan to raise up to $25bn in equity and debt and its agreement of a $10bn new credit facility, with one saying that “it was needed, expected and more importantly wanted by the markets”.
“The debt facility is a bridge with no intended purpose of being a long-term financing. If it is, that’s a larger problem,” the bondholder added.
Another called it a “smart strategy by management” to reassure the market while Boeing negotiated with the machinists’ union.
Significant uncertainty, however, remains over the size of a potential equity issuance, with concerns that Boeing may have to raise more at a later date if it does not raise enough now.
“To me, I would expect and/or hope that any equity issuance raised would be closer to $15bn and not $10bn,” the bondholder said.
Boeing is “too big to fail in the eyes of the US government”, said a second bondholder.
“However, it’s not too big to become high-yield. Our major concern is that the longer this goes, the [more likely it is that] rating agencies will be forced to take some action.”
The company, the bondholder added, had a “very luxurious position in that the credit markets have lost their minds at the moment and are giving anybody money. We’re stunned at how tight the credit spreads are for Boeing given everything it’s dealing with.”
Will Boeing avert a credit downgrade?
Boeing’s investment-grade rating is crucial to its operations and losing it would be a serious blow. The company could face a big increase in borrowing costs given its hefty debt burden.
Rating agency S&P Global Ratings warned earlier this month that a downgrade of Boeing’s debt into junk territory was possible in light of the strike at its main factories, which it estimated could cost the company $1bn a month.
Boeing said last week that it had $10.5bn in cash and marketable securities at the end of September — close to the minimum it has said it needs to operate — after burning through $1.3bn in cash during the third quarter.
“Ultimately, the company has to resolve the strike and really be on a path to building planes again in order to maintain the rating,” Ben Tsocanos, aerospace director at S&P Global Ratings, said on Tuesday. For now, “they have bought themselves some time”.
Whether Boeing had done enough to avert a possible credit downgrade would depend on the “execution” of its fundraising, including whether it featured less traditional forms of capital, such as hybrid or preferred equity, he said.
The company was also constrained in how much it can raise by its valuation, according to Tsocanos. Raising more than $10bn in equity would in effect require issuing more than 10 per cent of its $94bn market capitalisation, he noted.
Boeing’s rating had, until this point, also been supported by its market position in a duopoly with Europe’s Airbus, Tsocanos added.
“Ultimately, they need to make and deliver aeroplanes. They would have a lower rating if they didn’t have the market positioning in a duopoly.”
What are Boeing’s workers saying?
Boeing factory workers were showing little sign of returning to the negotiation table, holding a large rally in Seattle on Tuesday afternoon to put pressure on the company.
The industrial action by 33,000 members of the International Association of Machinists and Aerospace Workers, which began on September 13, has halted production of the 737 Max, 767 and 777 aircraft at Boeing’s factories in Washington.
The company earlier this month withdrew its second offer to the workers, saying the union had not seriously considered its proposals. Both sides have filed charges accusing the other of unfair labour practices during negotiations.
Acting labour secretary Julie Su flew to Seattle on Monday to meet company and union representatives in a bid to break the deadlock.
What does this mean for Boeing’s airline customers?
Airlines are increasingly worried about the crisis engulfing Boeing, which has led to significant delivery delays and exacerbated a global shortage of new planes.
The crisis has rippled across the world. Europe’s largest airline, Ryanair, lowered its growth plans for the next two years because of delays receiving 737 Max planes, while Southwest Airlines’ reliance on Boeing forced it to reduce capacity earlier this year.
Dubai’s Emirates, the largest customer for Boeing’s repeatedly delayed 777X aircraft, has made “significant and highly expensive amendments to our fleet programmes as a result of Boeing’s multiple contractual shortfalls”, president Sir Tim Clark said this week.
“I fail to see how Boeing can make any meaningful forecasts of delivery dates . . . we will be having a serious conversation with them over the next couple of months,” he said.
Carriers with orders at the US manufacturer, however, have limited options. Its arch-rival Airbus has a full order book and is suffering its own production delays.
Demand for planes remained “very robust due both to travel growth and replacement,” said a portfolio manager at a big asset manager, who echoed Toscanos’ belief that the industry’s duopoly was a positive for Boeing.
“We think the challenges they face are fixable; it’s going to take a while but ultimately the underlying assets here are quite high-quality,” the bondholder said, adding that even if Boeing were to fall into junk territory, high-yield investors “would be very interested in having this kind of risk”.


 By Alaina Trivax, WCI Columnist


.png?width=1200&name=MicrosoftTeams-image%20(11).png&w=696&resize=696,0&ssl=1 "Growth in Community Banking:")
.png?width=1200&name=MicrosoftTeams-image%20(11).png "Growth in Community Banking:")