Home Blog Page 27

How to Build a Long Range Plan

0
How to Build a Long Range Plan

Today’s post is a deep dive into building a multi year operating model, which many people call a Long Range Plan (LRP).

Here’s what we’ll cover so you can build one yourself:

  • Chapter 1: Introduction to Long-Range Planning

  • Chapter 2: Laying the Foundation

  • Chapter 3: Modeling Sales Capacity

  • Chapter 4: Modeling Labor Costs

  • Chapter 5: Structuring Non-Payroll Expenses

  • Chapter 6: New Customer Acquisition

  • Chapter 7: Existing Customer Retention & Expansion

  • Chapter 8: Operating Margins and Cash Flows

  • Chapter 10: The Role of Benchmarks

A long-range plan (LRP) bridges the current year’s tactics to longer-term business objectives. It confirms and supports investor expectations. The goal is to progress the company along two critical dimensions:

  • Revenue Durability: Prove customers can be acquired at a predictable cost, retained, and expanded over their lifecycle.

  • Free Cash Flow Sustainability: The company reaches a point where it no longer relies on external capital, and has thought through where profits will go (i.e., reinvest for growth, distribute to shareholders, etc.)

Long-range planning is an exercise in resource allocation across several years. It marches the company towards what “good” looks like at “scale”, however you define both of those characteristics in the context of the industry you play in.

While annual planning is more granular and focused on specific targets for the next 12 months, long-range planning is about setting directional goals for the business that arrive at a target financial profile over time. It’s more strategic, requiring a marriage of top-down industry forecasts with bottom-up operational realities.
How to Build a Long Range Plan

Long-range planning also forces companies to consider the full product lifecycle, from roadmap development to monetization. It’s not just about optimizing current products but also forecasting when new products will hit the market, estimating both their costs and revenues.

While in an annual operating plan you forecast at the general ledger (GL) level and by vendor names (e.g.,. Salesforce, Gong, NetSuite), you can theoretically build a solid LRP by concentrating on go to market resources, GTM output, and grossing up the remaining non payroll items using a set of basic assumptions.

Why is that possible?

70% to 80% of software company expenses are people related. 10% to 20% are hosting and infrastructure. And the remaining bits and pieces are nonpayroll, like rent and travel. Most of the juice is in the people bucket, and much of the rest can be rolled forward within a relatively high degree of accuracy, especially if the underlying assumptions are linked to said headcount growth.

The type of LRP you build will be based on:

  • The current state of financial maturity at your company

  • The specific questions you are trying to answer at that point in time

  • How much time you are willing to spend on it

To drill into the last point – you can always go deeper and take longer to turn the screws; but the real question is what you’ll be using this model for. That should dictate the LRP’s dimensionality (HardMode by Thomas Robb).

It’s common to have one core LRP the org relies on for board purposes, and to “version up” on an ad hoc basis when you need to stress test what doing [xyz] would look like. Remember – we’re designing a tool for longer term decision making; not a statue for the Louvre.

The biggest thing I try to focus on, since revenue growth is the most important, is giving as much detail as possible to the go to market (GTM) side of the house. If there is an area I want to spend more time on, I push to add more information on sales capacity:

GTM resources not only dictate the company’s revenue capacity for future years, they also make up more than 50% of headcount costs. So getting your GTM modeling right, including productivity and cost, determines your LRPs strategic value.

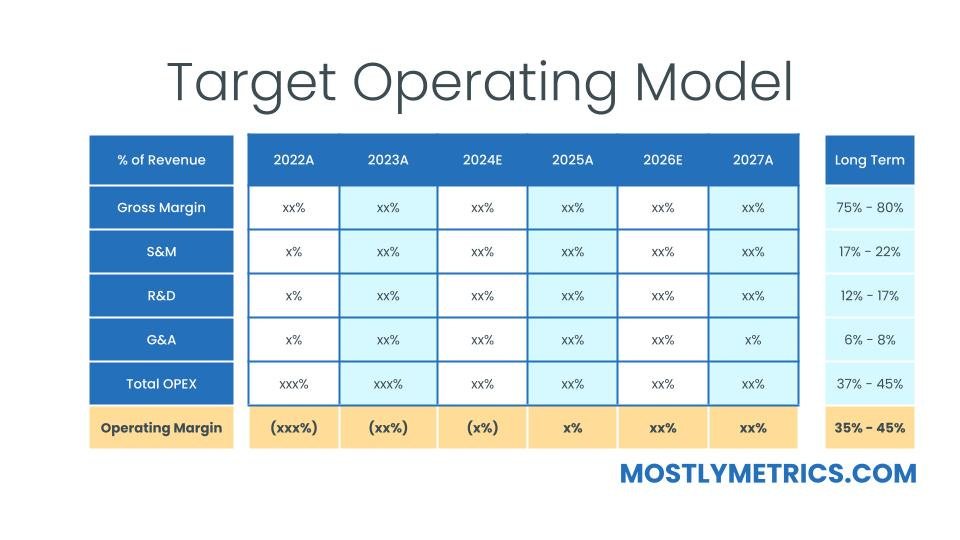
Building a strong LRP starts with defining your key assumptions. Typical assumptions might be:

  • We will launch one new product per year.

  • We’ll rely on areas outside the US to make up 25% or more of our revenue at some point

  • We’d like to capture 10% of our total addressable market (TAM)

  • We strive to achieve positive cash flows within the next 24 months

  • We must maintain a revenue growth endurance score of 70% or more

  • We will ensure our ARR per head is top quartile, based on benchmarks

The FP&A or Strategic Finance team should maintain an “assumptions log,” revisiting and revising it over time to ensure the objectives and assumptions evolve with the business.

As we mentioned, this is where the rubber hits the road. Ensure you plan for the following:

Singapore Blocks Allianz’s Bid for Income Insurance Over Public Interest Concerns

0
Singapore Blocks Allianz’s Bid for Income Insurance Over Public Interest Concerns

The Singapore government has blocked NTUC Enterprise’s proposed sale of Income Insurance shares to Allianz, citing concerns over the structure of the deal.

The decision comes despite no objections to Allianz’s suitability as a partner.

The government has tabled an amendment to the Insurance Act in Parliament, enabling the Monetary Authority of Singapore (MAS) to withhold approval of transactions involving current or former cooperative insurers if public interest is at stake.

Singapore Blocks Allianz’s Bid for Income Insurance Over Public Interest Concerns
Minister Edwin Tong

Minister Edwin Tong explained in a ministerial statement that the government supports a strong partner for Income to strengthen its capital base, but concerns arose from the transaction’s structure, especially in light of assurances made during Income’s corporatisation in 2022.

MITB FNN

The government highlighted the lack of clarity on how the deal would affect Income’s social mission, a core principle it committed to uphold during its transition from a cooperative to a corporate entity.

Income Insurance was corporatised in 2022, transitioning from NTUC Income Co-operative Ltd to a company structure.

The move aimed to enable the insurer to better compete in a tightening regulatory environment and attract strategic partners.

During this process, Income carried over S$2 billion in surplus, which was granted an exemption by the Ministry of Culture, Community and Youth (MCCY) to support its business continuity.

However, the government now questions how this surplus would be used under the Allianz deal, as there is no clear plan to ensure the funds would continue to support Income’s social mission.

The proposed sale involved Allianz acquiring a 51% stake in Income for S$2.2 billion, with a plan to streamline operations and optimise capital, including a projected S$1.85 billion capital return to shareholders within three years of the transaction.

This potential capital extraction raised concerns, as it contradicts Income’s earlier representations to MCCY that the corporatisation aimed to build capital strength.

In response to these concerns, the government has decided to intervene, believing that the deal, in its current form, may undermine the social mission of both Income and the cooperative movement in Singapore.

Although the financial prudential requirements have been met, the government’s focus extended beyond regulatory capital adequacy to include the broader impact on Income’s role as a social enterprise.

Income Insurance has acknowledged the government’s decision and committed to take into consideration the proposed amendments to the Insurance Act.

The company affirmed it would work closely with relevant stakeholders to consider the next steps.

NTUC Enterprise echoed this statement saying,

“NTUC Enterprise has consistently acted in good faith to safeguard the interests of shareholders, policyholders and employees of Income Insurance. It believes that Allianz’s offer will enable Income Insurance to be even more relevant and resilient over the long term, to fulfil its social commitments, and meet its obligations to its policyholders.

NTUC Enterprise will study carefully the implications of the Ministerial Statement by Minister Edwin Tong and the amendments to the Insurance Act, and work closely with relevant stakeholders to decide on the next course of action.”

Allianz, one of the world’s largest insurance companies, expressed respect for the government’s position and indicated it will collaborate with Income and NTUC Enterprise to consider revisions to the transaction structure.

“We are convinced that partnering with Income Insurance, a company that shares Allianz’s values
and commitment to customer excellence, will benefit Singapore’s customers and society,”

the insurer said in a statement.

The amendment to the Insurance Act, which was tabled on 14 October 2024, is set to be debated further in Parliament on 16 October 2024.

The changes will allow MAS to consider broader public interest issues when assessing transactions involving cooperative-linked insurers, ensuring that future deals align with both financial prudence and social objectives.


Featured image credit: Edited from Pexels

Growth in Community Banking:

0
Growth in Community Banking:

Growth in Community Banking:


Balancing Increased FTE Expense with Improved Process Efficiencies

Across various parts of the country, community banks and credit unions are experiencing massive overall growth. This has led to faster growth in return on asset ratios, higher net interest margins, and higher loan growth rates. Even with looming economic hurdles on the horizon and talks of an impending recession, executives at these community financial institutions are trying to strike the balance between managing the growth, maintaining operational efficiency, maximizing talent management, and navigating new employee hiring cycles. At an elevated level, let’s focus on this continuous attempt for community lenders to find the balance on these multiple fronts.

Happy 60th Anniversary CAPM! Why the Capital Asset Pricing Model Still Matters

0
Happy 60th Anniversary CAPM! Why the Capital Asset Pricing Model Still Matters

When someone hears I’m currently writing the authorized biography of William (Bill) Sharpe, the most frequent question I get is, “Is he still alive?” Sharpe is the 1990 recipient of the Sveriges Riksbank Prize in Economic Sciences in Memory of Alfred Nobel, commonly known as the Nobel Prize in Economics. And, yes, in September 2024, he is still alive and well. He lives in Carmel-by-the-Sea in California. Every Thursday morning, he meets with his coffee klatch. He can often be seen walking his bichon-poodle near Carmel Bay. In June 2024, he celebrated his 90th birthday.

And September 2024 was another Sharpe milestone: the 60th anniversary of his seminal capital asset pricing model (CAPM) paper in The Journal of Finance. It is extremely rare for research to remain relevant after a decade let alone six. I’ll explain what the paper is about, how it impacted the investment industry, most likely including your own portfolio, and why it still matters.

Happy 60th Anniversary CAPM! Why the Capital Asset Pricing Model Still Matters

Photo by Stephen R. Foerster

The C-A-P-M

Let’s talk about the model’s name, common acronym, and what it’s really about. First, Sharpe never called it the “capital asset pricing model.” As the title of his seminal article indicates, it’s about “capital asset prices.” Later researchers referred to it as a model, adding the M. Second, once it became known as the capital asset pricing model, it was referred to by the acronym CAPM, pronounced “cap-em.”

Virtually every finance professor and student refer to it as “cap-em” — everyone except Sharpe himself. He always uses the initialism C-A-P-M. (So, if you want to honor the creator of the model, you can refer to it as the C-A-P-M!) Third, the focus isn’t really about prices of assets, but rather their expected returns. One of the key insights of the CAPM is that it answers an important investment question: “What is the expected return if I purchase security XYZ?”

Subscribe Button

Key Assumptions

Sharpe had written a paper published in 1963, “A Simplified Model for Portfolio Analysis,” that presented some of the same key concepts as in the seminal 1964 paper. There is an important difference between the two papers. As Sharpe later described it, in the 1963 paper, he carefully “put the rabbit in the hat” before pulling it out. The 1963 paper also answered that key question, “What is the expected return if I purchase security XYZ?”

But the rabbit he put in the hat was a preordained relationship between a security and the overall market — what I’ll describe later as beta. Andrew Lo and I interviewed Sharpe for our book, In Pursuit of the Perfect Portfolio: The Stories, Voices, and Key Insights of the Pioneers Who Shaped the Way We Invest. “So, I spent several months trying to figure out how to do it without putting the rabbit in the hat,” he said. “Was there a way to pull the rabbit out of the hat without putting it in to begin with? I figured out yes, there was.” In the 1964 article, Sharpe didn’t put a rabbit in the hat but rather he derived a market equilibrium based on theory.

With any theory, you need to make assumptions, to simplify what happens in the real world, so that you can get traction with the theoretical model. That’s what Sharpe did. He assumed that all that investors care about are expected returns and risk. He assumed investors were rational and well-diversified. And he assumed investors could borrow and lend and the same rate.

When Sharpe initially submitted the paper for publication in The Journal of Finance, it was rejected, mainly because of Sharpe’s assumptions. The anonymous referee concluded that the assumptions Sharpe had made were so “preposterous” that all subsequent conclusions were “uninteresting.” Undeterred, two years later Sharpe made some paper tweaks, found a new editor, and the paper was published. The rest, as they say, is history.

Happy 60th Anniversary CAPM! Why the Capital Asset Pricing Model Still Matters

The CAPM in Pictures

Much of Sharpe’s classic paper focuses on nine figures or graphs. The first seven are in two-dimensional space, with risk — as measured by the standard deviation of expected returns — on the vertical axis and expected return on the horizontal axis. (Any finance student will quickly note that the now-common practice is to flip axes, which is represent risk on the horizontal axis and expected return on the vertical axis.)

On his horizontal axis, Sharpe began with the return on a special security that he called the “pure interest rate” or P. Today, we would refer to that special rate as the Treasury Bill return, or the risk-free rate, commonly represented as Rf.

Happy 60th Anniversary CAPM! Why the Capital Asset Pricing Model Still Matters

The curve igg’ is Harry Markowitz’s efficient frontier: the “optimal” combination of risky securities such that each portfolio on the curve has the highest expected return for a given level of risk, and also the lowest risk for a given level of expected return. Sharpe’s model essentially looked for combinations of the risk-free security, P, with each portfolio on the curve igg’ that would provide the optimal risk-expected return. It is clear from the graph that the optimal mix is formed by a line from P that is tangent to curve igg’ — in other words, the mix that combines the risk-free asset P and portfolio g.

In Sharpe’s world, we can think of the investor as essentially having three choices. She can invest all of her money in risky portfolio g. If that’s too much risk for her, she can divide her portfolio between combinations of risk-free P and risky g. Or, if she wants even more risk she can borrow at the risk-free rate and invest more than 100% of her wealth in risky g, essentially moving along the line toward Z. The line PgZ is Sharpe’s famous Capital Market Line, showing the optimal combination of risk-free and risky investments, including either lending (buying a Treasury Bill) or borrowing (at the Treasury Bill rate).

The Footnote that Won a Nobel Prize

After presenting a series of graphs, Sharpe showed how this could lead to “a relatively simple formula which relates the expected rate of return to various elements of risk for all assets which are included in combination g. He then refers the reader to his footnote 22, an extensive 17 lines of equations and text that may be one of the most consequential footnotes in all of finance and economics literature.

Happy 60th Anniversary CAPM! Why the Capital Asset Pricing Model Still Matters

That last line of the footnote may not look familiar, but with a bit of sleight-of-hand it will come into focus. Sharpe gave the left-hand-side a new name: Big, with “ig” as the subscript. In technical terms, Big is the covariance of the return on security i relative to security g, divided by the standard deviation of g. When creating the manuscript, Sharpe used a typewriter, with standard keys. What he really meant by B was the Greek letter b or beta. And as we’ll see, that has become one of the most used measures of risk today.

What Drives Expected Returns?

One of the key insights from Sharpe’s model is that when it comes to a security’s expected return, all that matters is Big, or beta.

Happy 60th Anniversary CAPM! Why the Capital Asset Pricing Model Still Matters

In Sharpe’s final graph, expected return is still on the horizontal axis, but his new measure of risk, Big or beta, is on the vertical axis. Now the line PQ is actual the CAPM equation. What it powerfully shows is that, assuming an investor holds a well-diversified portfolio, the only measure of risk that matters is beta, or how risky the security is relative to the overall portfolio g. Since all investors want to hold g, then it must contain all assets. In other words, it must be the market portfolio. Today, we call that portfolio M.

We can now re-write Sharpe’s original derivation of the CAPM to the more-familiar version: E(Ri) = Rf + b x [E(Rm) – Rf] or E(Ri) = Rf + bi x MRP, where i represents security i and MRP is the market risk premium. Here’s the intuition. Let’s suppose you’re considering investing in a stock for the next 10 years — or maybe not. Alternatively, you could invest in long-term Treasuries and secure a return of Rf. Or you could invest in the market as a whole and get an expected return of E(Rm). That works out to be the same as Rf + MRP. Or finally, you could invest in security i. Your expected return, E(Ri) would be driven by how much market risk you are exposed to, bi.

Beta has a simple interpretation: how risky a particular security is relative to the overall market. In terms of benchmarks, by definition “the market” has a beta of 1.0. For a particular security, beta suggests what the particular return change is for every 1.0% change in the market. For example, for a low-risk stock with a beta of 0.5, if the market (often proxied as the S&P 500 Index) goes up by 1.0 percent, we would expect stock i to go up by 0.5 percent; if the market is down by 1.0%, we expect stock i to go down by 0.5 percent. The same logic holds for a risky stock, say with a beta of 1.5. If the market goes up by 1.0%, we would expect stock i to go up by 1.5%. If the market is down by 1.0 percent, we expect stock i to go down by 1.5%.

Why the CAPM Still Matters

Sharpe’s seminal 1964 paper matters for three reasons.

  1. Beta is the appropriate measure of risk for a stock that is part of a diversified portfolio. It is also a widely available measure, on sites such as Yahoo!Finance. All that matters is risk relative to the market. If you have a diversified portfolio, it doesn’t matter how volatile a stock is on its own.
  2. Sharpe’s model, and in some sense Figure 7, shows us a way to measure performance across well-diversified portfolios such as mutual funds. We can measure a fund’s performance or return, say over the past five years, in excess of what a risk-free investment would have returned. That’s the return measure. If we compare that to the fund’s risk, as measured by the standard deviation of the fund’s return over that period, we have a return-to-risk measure. That’s what Sharpe described in subsequent research papers and became known as the Sharpe ratio. It’s probably the most common measure of performance today.
  3. In Sharpe’s CAPM paper, he defined his special portfolio, g, the one that everyone would want to hold, as one that represented “all assets.” That’s why we call it the market portfolio. In a narrower interpretation, it should at least contain all stocks. Specific to the United States, that implies buying an index fund like one that replicates the S&P 500 Index. We have Sharpe’s model to thank for the multi-trillion-dollar index fund that has emerged over the past 50 years. Chances are that you’re invested in an index fund, either directly or indirectly, say through a pension fund.

Of course, the CAPM has its critics. There are some competing models of expected return that capture additional factors beyond the market. There are some questionable empirical test results. And yet, the model is still front and center in finance courses and still used by practitioners. And it’s a very intuitive model. It has stood the test of time.

So please join me in wishing the CAPM a happy birthday, with many more to come!

Financial Analysts Journal Current Issue Tile

Defining Bull and Bear Markets

0
Defining Bull and Bear Markets

A reader asks:

I’ve heard Ben mention several times recently that we are in year 15 of a bull market. He’s obviously referencing the end of the GFC in 2009 as the start of the current market cycle. Have we not had two bear markets in 2020 and 2022 (defined as -20% from the high)? When you had Tom Lee on last year (TCAF) he said 2024 was going to be year 2 of a bull, so he’s got a different definition. Can you please explain what people in the finance community use to define ends/beginnings of cyclical markets?

Here’s the chart in question from a recent blog post:

Defining Bull and Bear Markets

Did the bull market from 2009 get reset in 2020 or 2022? Or should we keep it going just like we did with the 1987 crash during that bull market?

The problem is these things aren’t exactly scientific.

There are some loosely accepted definitions but you have secular bull and bear markets as well as cyclical bull and bear markets. Things can get murky since different investors have different rules when it comes to hitting the reset button and starting over.

One standard definition is a loss of 20% or more means the start of a bear market and end of a bull market, at least on a cyclical basis.

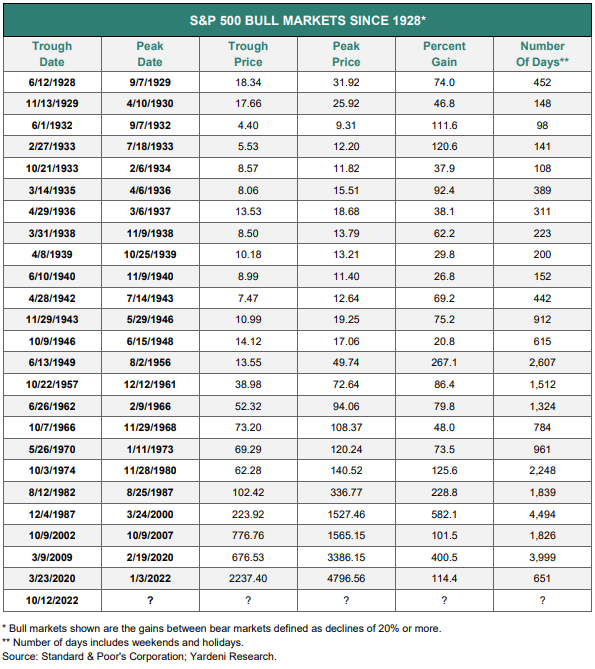
Yardeni Research publishes some handy historical bull and bear market tables1 going back to the 1920s. Here’s the bull market table:

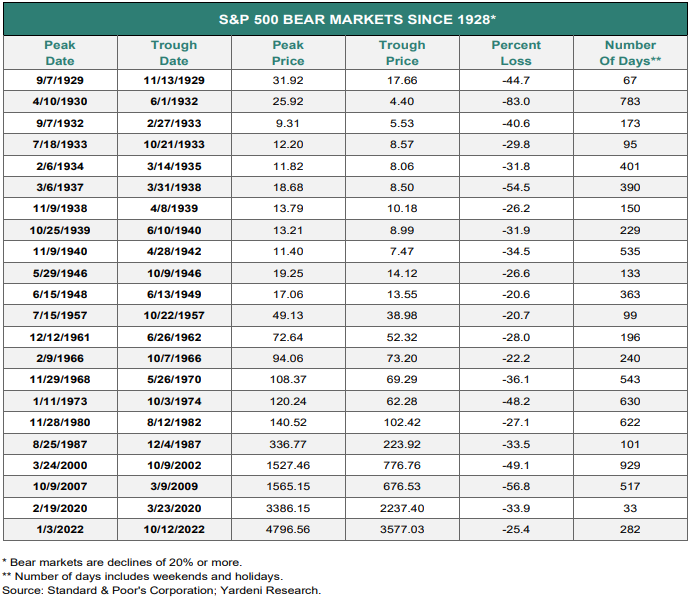
And the bear markets:

You can see there are plenty of both bull and bear markets.

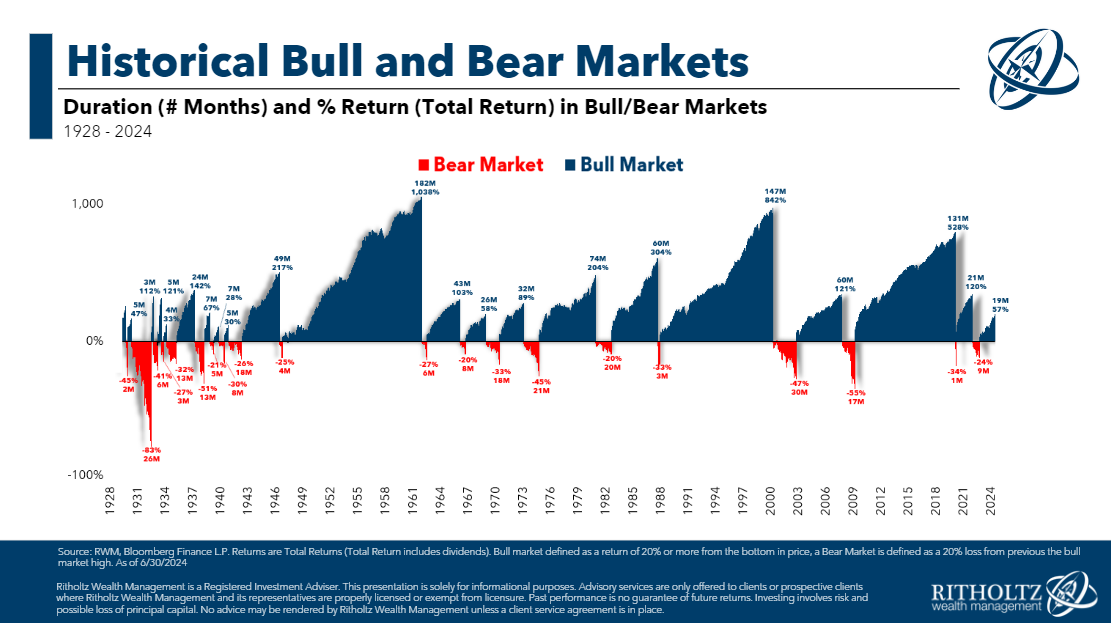
Here’s a chart we created that allows you to visualize these cycles:

It is important to recognize that using this 20% definition puts many of these bull and bear markets in the cyclical stage.

The problem is many of them were just countertrend rallies or downturns within the context of a broader long-term uptrend or downtrend.

For example, there was a cyclical bull market from the end of 1929 through early 1930 when stocks rose ~50%. The Great Depression crash didn’t technically bottom until 1932. No one looks back at that dead cat bounce as a bull market. It was a minor reprieve during a massive downturn.

The 1987 crash was the opposite. No one really thinks the 1980s bull market ended in 1987. That was a countertrend crash but the bull market charged higher for many years after that.

The Covid crash was our 1987 moment. And the 2022 bear market was run-of-the-mill not some giant financial crisis that altered the secular uptrend.

Take a look at my version of secular bull and bear markets:

So while there are 20+ cyclical bull and bear markets over the past 100 years or so, there have really only been six secular longer-term periods.

The extended secular bull market from 1942-1965 is a good example of why you can’t call an end to a long-term bull market just because stocks were in a technical bear market. In this time frame, the S&P 500 was up almost 13% after accounting for inflation, but there were setbacks along the way.

I count four bear markets:

  • 1946 -26.6%
  • 1948-1949 -20.6%
  • 1957 -20.7%
  • 1961-1962 -28.0%

There is a difference between a bear market and a crash.

There have also been a handful of 19% and change corrections over time. I count four since the mid-1970s — in 1976-1978 (-19.4%), 1990 (-19.9%), 2011 (-19.4%) and 2018 (-19.8%). If we’re being generous we could round those up. It’s not like a 20% loss feels any worse than a 19% loss.

The one big difference between the current run and previous versions is that this secular bull market started at the very bottom of an earth-shattering bear market, which wasn’t the case in previous bull runs.

The stock market bottomed in 1932 but the bull market didn’t start until 1942.

The stock market bottomed in 1974 but the bull market didn’t start until 1982.

This time around the stock market bottomed in 2009 and the bull market started immediately. There was no sideways move following the Great Financial Crisis, just a giant V-shaped recovery.

What changed?

Basically, we now get bazookas fired by the government and the Fed. Monetary and fiscal policy are used during financial crises on a scale we’ve never seen before. During the Great Depression, the Fed and government worsened the situation by tightening spending and Fed policy.

We’ve learned our lessons from the past.

I’m not saying we can’t have extended bear markets anymore. We can and will.

But the addition of fiscal and monetary stimulus during the worst downturns means the snapbacks will likely come quicker than they did in the past (assuming that stimulus doesn’t go away).

Is this entire conversation a bit of semantics?

Yes.

But so are most historical stock market conversations because markets don’t operate like physics. Most of the time we can’t define these things until after the fact.

And that’s what makes them interesting to argue about.

There are no scientific relationships in the markets so we have to make stuff up as we go.

We discussed this question on the latest edition of Ask the Compound:


Nick Maggiulli joined me on the show this week to tackle questions about investing in total stock market index funds, how to value your pension, factors that allow you to take more risk in your portfolio and when to sell your big winners.

Further Reading:
An Epic Bull Market

1It’s worth noting these are price returns only, no dividends included.

Has Boeing done enough to avoid the credit rating junk yard?

0
Has Boeing done enough to avoid the credit rating junk yard?

Boeing’s announcement on Tuesday that it plans to shore up its finances with up to $35bn in new funding is the latest response to a crisis that has engulfed the US plane maker over the past five years. 

Fatal crashes of its 737 Max aircraft in 2018 and 2019, followed by the Covid-19 pandemic and January’s mid-flight blowout of a door panel on one of its planes, had already severely stretched the company’s finances. 

Boeing, which last reported a profit in 2018 and has consolidated debt close to $58bn, is burning through an estimated $1bn a month as a strike by its largest labour union has halted production at its main factories in Washington state since last month.

With the strike showing little sign of ending any time soon, the pressing question is whether the company has done enough to preserve its investment credit rating.

Has Boeing done enough to please bondholders?

Bondholders the Financial Times spoke to broadly welcomed Boeing’s plan to raise up to $25bn in equity and debt and its agreement of a $10bn new credit facility, with one saying that “it was needed, expected and more importantly wanted by the markets”. 

“The debt facility is a bridge with no intended purpose of being a long-term financing. If it is, that’s a larger problem,” the bondholder added.

Another called it a “smart strategy by management” to reassure the market while Boeing negotiated with the machinists’ union. 

Significant uncertainty, however, remains over the size of a potential equity issuance, with concerns that Boeing may have to raise more at a later date if it does not raise enough now. 

“To me, I would expect and/or hope that any equity issuance raised would be closer to $15bn and not $10bn,” the bondholder said. 

Boeing is “too big to fail in the eyes of the US government”, said a second bondholder. 

“However, it’s not too big to become high-yield. Our major concern is that the longer this goes, the [more likely it is that] rating agencies will be forced to take some action.”

The company, the bondholder added, had a “very luxurious position in that the credit markets have lost their minds at the moment and are giving anybody money. We’re stunned at how tight the credit spreads are for Boeing given everything it’s dealing with.”

Has Boeing done enough to avoid the credit rating junk yard?

Will Boeing avert a credit downgrade?

Boeing’s investment-grade rating is crucial to its operations and losing it would be a serious blow. The company could face a big increase in borrowing costs given its hefty debt burden. 

Rating agency S&P Global Ratings warned earlier this month that a downgrade of Boeing’s debt into junk territory was possible in light of the strike at its main factories, which it estimated could cost the company $1bn a month.

Boeing said last week that it had $10.5bn in cash and marketable securities at the end of September — close to the minimum it has said it needs to operate — after burning through $1.3bn in cash during the third quarter.

“Ultimately, the company has to resolve the strike and really be on a path to building planes again in order to maintain the rating,” Ben Tsocanos, aerospace director at S&P Global Ratings, said on Tuesday. For now, “they have bought themselves some time”.

Whether Boeing had done enough to avert a possible credit downgrade would depend on the “execution” of its fundraising, including whether it featured less traditional forms of capital, such as hybrid or preferred equity, he said.

The company was also constrained in how much it can raise by its valuation, according to Tsocanos. Raising more than $10bn in equity would in effect require issuing more than 10 per cent of its $94bn market capitalisation, he noted.

Boeing’s rating had, until this point, also been supported by its market position in a duopoly with Europe’s Airbus, Tsocanos added.

“Ultimately, they need to make and deliver aeroplanes. They would have a lower rating if they didn’t have the market positioning in a duopoly.”

What are Boeing’s workers saying? 

Boeing factory workers were showing little sign of returning to the negotiation table, holding a large rally in Seattle on Tuesday afternoon to put pressure on the company. 

The industrial action by 33,000 members of the International Association of Machinists and Aerospace Workers, which began on September 13, has halted production of the 737 Max, 767 and 777 aircraft at Boeing’s factories in Washington. 

The company earlier this month withdrew its second offer to the workers, saying the union had not seriously considered its proposals. Both sides have filed charges accusing the other of unfair labour practices during negotiations. 

Acting labour secretary Julie Su flew to Seattle on Monday to meet company and union representatives in a bid to break the deadlock.

Boeing factory workers hold a large rally in Seattle
Boeing factory workers held a large rally in Seattle on Tuesday to put pressure on the company © AP

What does this mean for Boeing’s airline customers?

Airlines are increasingly worried about the crisis engulfing Boeing, which has led to significant delivery delays and exacerbated a global shortage of new planes. 

The crisis has rippled across the world. Europe’s largest airline, Ryanair, lowered its growth plans for the next two years because of delays receiving 737 Max planes, while Southwest Airlines’ reliance on Boeing forced it to reduce capacity earlier this year. 

Dubai’s Emirates, the largest customer for Boeing’s repeatedly delayed 777X aircraft, has made “significant and highly expensive amendments to our fleet programmes as a result of Boeing’s multiple contractual shortfalls”, president Sir Tim Clark said this week. 

“I fail to see how Boeing can make any meaningful forecasts of delivery dates . . . we will be having a serious conversation with them over the next couple of months,” he said. 

Carriers with orders at the US manufacturer, however, have limited options. Its arch-rival Airbus has a full order book and is suffering its own production delays. 

Demand for planes remained “very robust due both to travel growth and replacement,” said a portfolio manager at a big asset manager, who echoed Toscanos’ belief that the industry’s duopoly was a positive for Boeing.

“We think the challenges they face are fixable; it’s going to take a while but ultimately the underlying assets here are quite high-quality,” the bondholder said, adding that even if Boeing were to fall into junk territory, high-yield investors “would be very interested in having this kind of risk”.

NYC Bill For Bird-Friendly Windows Significantly HIkes Building Costs

0
NYC Bill For Bird-Friendly Windows Significantly HIkes Building Costs

NYC Bill For Bird-Friendly Windows Significantly HIkes Building Costs

This new legislation, introduced by council members Tiffany Cabán and Shaun Abreu, aims to address the risks posed by older buildings that were not covered by Local Law 15 and prevent bird collisions, which account for the death of approximately 250,000 birds in NYC annually.

Whether it’s refining your business model, mastering  new technologies, or discovering strategies to capitalize on the next market surge, Inman Connect New York will prepare you to take bold steps forward. The Next Chapter is about to begin. Be part of it. Join us and thousands of real estate leaders Jan. 22-24, 2025.

A bill proposed by New York City Council members would require large buildings to install bird-friendly windows by 2030, a move that could be costly for property owners, The Real Deal reported on Monday. The bill expands on Local Law 15 of 2020, which mandated bird-safe materials for new or renovated buildings but excluded existing structures due to cost concerns.

This new legislation, introduced by council members Tiffany Cabán and Shaun Abreu, aims to address the risks posed by older buildings that were not covered by Local Law 15 and prevent bird collisions, accounting for the death of approximately 250,000 birds in NYC annually.

Circa Central Park, a luxury condo on the Upper West Side, has already faced challenges in adopting bird-friendly measures. According to NYC Bird Alliance, it is one of the three deadliest buildings for birds in NYC.

To mitigate the issue, the condo installed dot stickers on windows to make the glass more visible to birds, spending around $60,000 on updates to the windows and railings. While some residents believe the bird protection measures preserve the building’s value, others have complained that the stickers obstruct their views of Central Park.

Bird advocates continue to explore solutions to make existing buildings safer, but treatments applied inside windows have proven ineffective, and exterior treatments are often expensive.

The Real Estate Board of New York (REBNY) raised concerns in 2019 during discussions of the original law. REBNY’s Basha Gerhards testified that compliance with bird-friendly glazing requirements — such as using bird-safe glass on 90 percent of exterior windows up to 75 feet and retrofitting balcony railings — could cause delays and significantly increase costs for building owners.

The additional expense for bird-friendly materials can range from 3 percent more for tinted glass, 12 percent for adhesive films and 50 percent more for specialty treated glass. At this time, only four manufacturers produced bird-friendly glass.

While REBNY supports reducing bird collisions, it has recommended exemptions for landmark buildings, rent-stabilized buildings, and affordable housing. A REBNY spokesperson expressed skepticism about the new bill, stating, “We are still reviewing this legislation, but we are skeptical such a radical step is warranted or achievable.”

Email Richelle Hammiel

Engaging your visitors – Optima

0
Engaging your visitors – Optima

Understand the rules

Far far away, behind the word mountains, far from the countries Vokalia and Consonantia, there live the blind texts. Separated they live in Bookmarksgrove right at the coast of the Semantics, a large language ocean. A small river named Duden flows by their place and supplies it with the necessary regelialia. It is a paradisematic country, in which roasted parts of sentences fly into your mouth.

The Big Oxmox advised her not to do so, because there were thousands of bad Commas, wild Question Marks and devious Semikoli, but the Little Blind Text didn’t listen.

Even the all-powerful Pointing has no control about the blind texts it is an almost unorthographic life One day however a small line of blind text by the name of Lorem Ipsum decided to leave for the far World of Grammar. The Big Oxmox advised her not to do so, because there were thousands of bad Commas, wild Question Marks and devious Semikoli, but the Little Blind Text didn’t listen. She packed her seven versalia, put her initial into the belt and made herself on the way.

Engaging your visitors – Optima

When she reached the first hills of the Italic Mountains, she had a last view back on the skyline of her hometown Bookmarksgrove, the headline of Alphabet Village and the subline of her own road, the Line Lane. Pityful a rethoric question ran over her cheek, then she continued her way. On her way she met a copy. The copy warned the Little Blind Text, that where it came from it would have been rewritten a thousand times and everything that was left from its origin would be the word “and” and the Little Blind Text should turn around and return to its own, safe country. But nothing the copy said could convince her and so it didn’t take long until a few insidious Copy Writers ambushed her, made her drunk with Longe and Parole and dragged her into their agency.


Blogging Theme

A small river named Duden flows by their place and supplies it with the necessary regelialia. It is a paradisematic country, in which roasted parts of sentences fly into your mouth. Far far away, behind the word mountains, far from the countries Vokalia and Consonantia, there live the blind texts. Separated they live in Bookmarksgrove right at the coast of the Semantics, a large language ocean.

When she reached the first hills of the Italic Mountains, she had a last view back on the skyline of her hometown Bookmarksgrove, the headline of Alphabet Village and the subline of her own road, the Line Lane.

ShearShare Update — Access One80

0
ShearShare Update — Access One80

ShearShare Update — Access One80

Every booking on ShearShare is now covered by $1,000,000 in liability protection, and stylists can purchase professional liability insurance by the day

DALLAS – ShearShare, the largest provider of on-demand salon and barbershop space rentals worldwide, today announced a partnership with Bigfoot Insurance, a Coverholder at Lloyd’s of London, and ibott, leaders in providing insurance to the sharing economy, to give users access to a custom portal to buy coverage specifically tailored to the ShearShare community.

ShearShare users will now be able to access usage-based insurance products to help them gain coverage when reserving workspace on the ShearShare platform.

“While most standard insurance markets would decline this type of business, Bigfoot and ibott accepted our unusual insurance risk because they see the value in our beauty and barbering industry and in the growing sharing and gig economies,” says Courtney Caldwell, cofounder & COO of ShearShare.

“We have the largest database of on-demand salon and barbershop space rentals and the most affordable leases in the market,” shares Dr. Tye Caldwell, cofounder & CEO of ShearShare and a 30-year beauty and barbering industry veteran. “With that comes the responsibility to alleviate host concerns so that they can get back to managing their small businesses safely and with confidence. For the individual stylist, our industry has never had the opportunity to advantage itself of a pay-for-what-you-need model; as ShearShare continues to pioneer B2B tools that meet our professionals where they are, it’s important that we partner with experts to support these business owners, especially as they rebound our local economies.”

Chris Moore, Head of ibott, says, “We are especially excited about the partnership with ShearShare because they are helping to revive small businesses during an unprecedented time in our history. As they continue to serve users with tenacity and resilience, we want to support that growth and be the enabler for new progressive business models like ShearShare. We are proud to provide coverage that is tailored to their level of exposure.”

Martin Burlingame, CEO of Bigfoot says, “Bigfoot’s long-standing brand promise of ‘delivering policies with hair’ fits the partnership with ShearShare quite naturally. We’ve utilized our rapid deployment engine HeyAlpaca to issue and distribute policies in alignment with their mobile platform. The gig economy is driving the future of work, and we are proud to support ShearShare on their journey.”

For more information, visit shearshare.com/ (http://shearshare.com/protection)professional-liability-insurance/

About ShearShare
ShearShare is the first machine learning-enabled marketplace that allows salon and barbershop owners to rent their excess suites and booths to licensed cosmetologists and barbers by the day. The ShearShare mobile platform gives owners a chance to make efficient use of their excess space by providing independent stylists short-term access based on a time and price that’s convenient for them. Launched in 2017, ShearShare currently serves industry professionals in more than 625 cities and 11 countries. For more information, visit ShearShare.com.

About ibott
ibott, an Apollo brand, insures some of the largest sharing economy and innovative companies in the world. ibott uses technology and innovation to provide service and solutions for their clients’ needs.

About Bigfoot
Bigfoot, a Coverholder at Lloyd’s of London, is a managing general agency and the country’s foremost expert in insuring Gig Economy platforms and contractors as well as other hard-to-place risks. Focused on offering solutions for the small to mid-sized agency, Bigfoot offers specialty programs across all 50 States. Bigfoot is the DBA of Commercial Insurance Group.

For more information, please contact:
Amanda Greenwood, ShearShare, amanda@shearshare.com
Kate Birtch, Director of Insurtech, Bigfoot Insurance, kate@bigfootbinds.com

Source: ShearShare, Inc. as seen on Txylo.com (Link)

Welcome to the all new ritholtzwealth.com

0
Welcome to the all new ritholtzwealth.com

The new online home of Ritholtz Wealth Management has (finally) arrived!

It’s ironic that we’re a firm with ten content creators and all these big blogs but we’ve never really paid much attention to what our corporate site looks like or how it works. It was just always an afterthought. Until today.

Our old site was fine. It just didn’t do anything for anyone. A place for clients to log in or to put a face with a name. There was no storyline, no emotional sweep, nothing showcasing our people or our culture. RWM is one of the most exciting, special places in all of financial advice (I’m biased, but still), and that had to come across in the way we presented ourselves online. That was the assignment.

We put our Chief Operating Officer and data analytics boss Nick Maggiulli in charge of the project. He nailed it! Special thanks to lead designer John Saunders and all the people at 5Four Digital for taking our vision and turning into something usable and fun.

Welcome to the all new ritholtzwealth.com

A lot of people I’ve shown it to have said there’s a little bit of an Avengers Assemble! vibe with the way our characters are front and center in front of the Manhattan skyline and when I heard it, I saw it immediately.

Helping investors make great decisions and saving them from harm is what we have always been about, since the firm’s founding ten years ago. And we still stand on it. Now and forever.

Here’s the site, hope you like it:

ritholtzwealth.com

This content, which contains security-related opinions and/or information, is provided for informational purposes only and should not be relied upon in any manner as professional advice, or an endorsement of any practices, products or services. There can be no guarantees or assurances that the views expressed here will be applicable for any particular facts or circumstances, and should not be relied upon in any manner. You should consult your own advisers as to legal, business, tax, and other related matters concerning any investment.

The commentary in this “post” (including any related blog, podcasts, videos, and social media) reflects the personal opinions, viewpoints, and analyses of the Ritholtz Wealth Management employees providing such comments, and should not be regarded the views of Ritholtz Wealth Management LLC. or its respective affiliates or as a description of advisory services provided by Ritholtz Wealth Management or performance returns of any Ritholtz Wealth Management Investments client.

References to any securities or digital assets, or performance data, are for illustrative purposes only and do not constitute an investment recommendation or offer to provide investment advisory services. Charts and graphs provided within are for informational purposes solely and should not be relied upon when making any investment decision. Past performance is not indicative of future results. The content speaks only as of the date indicated. Any projections, estimates, forecasts, targets, prospects, and/or opinions expressed in these materials are subject to change without notice and may differ or be contrary to opinions expressed by others.

Wealthcast Media, an affiliate of Ritholtz Wealth Management, receives payment from various entities for advertisements in affiliated podcasts, blogs and emails. Inclusion of such advertisements does not constitute or imply endorsement, sponsorship or recommendation thereof, or any affiliation therewith, by the Content Creator or by Ritholtz Wealth Management or any of its employees. Investments in securities involve the risk of loss. For additional advertisement disclaimers see here: https://www.ritholtzwealth.com/advertising-disclaimers

Please see disclosures here.

HowIInvestMyMoney